Immigrants from Latin America vs Samoan Disability Age Over 75
COMPARE
Immigrants from Latin America
Samoan
Disability Age Over 75
Disability Age Over 75 Comparison
Immigrants from Latin America
Samoans
49.5%
DISABILITY AGE OVER 75
0.0/ 100
METRIC RATING
284th/ 347
METRIC RANK
49.5%
DISABILITY AGE OVER 75
0.0/ 100
METRIC RATING
283rd/ 347
METRIC RANK
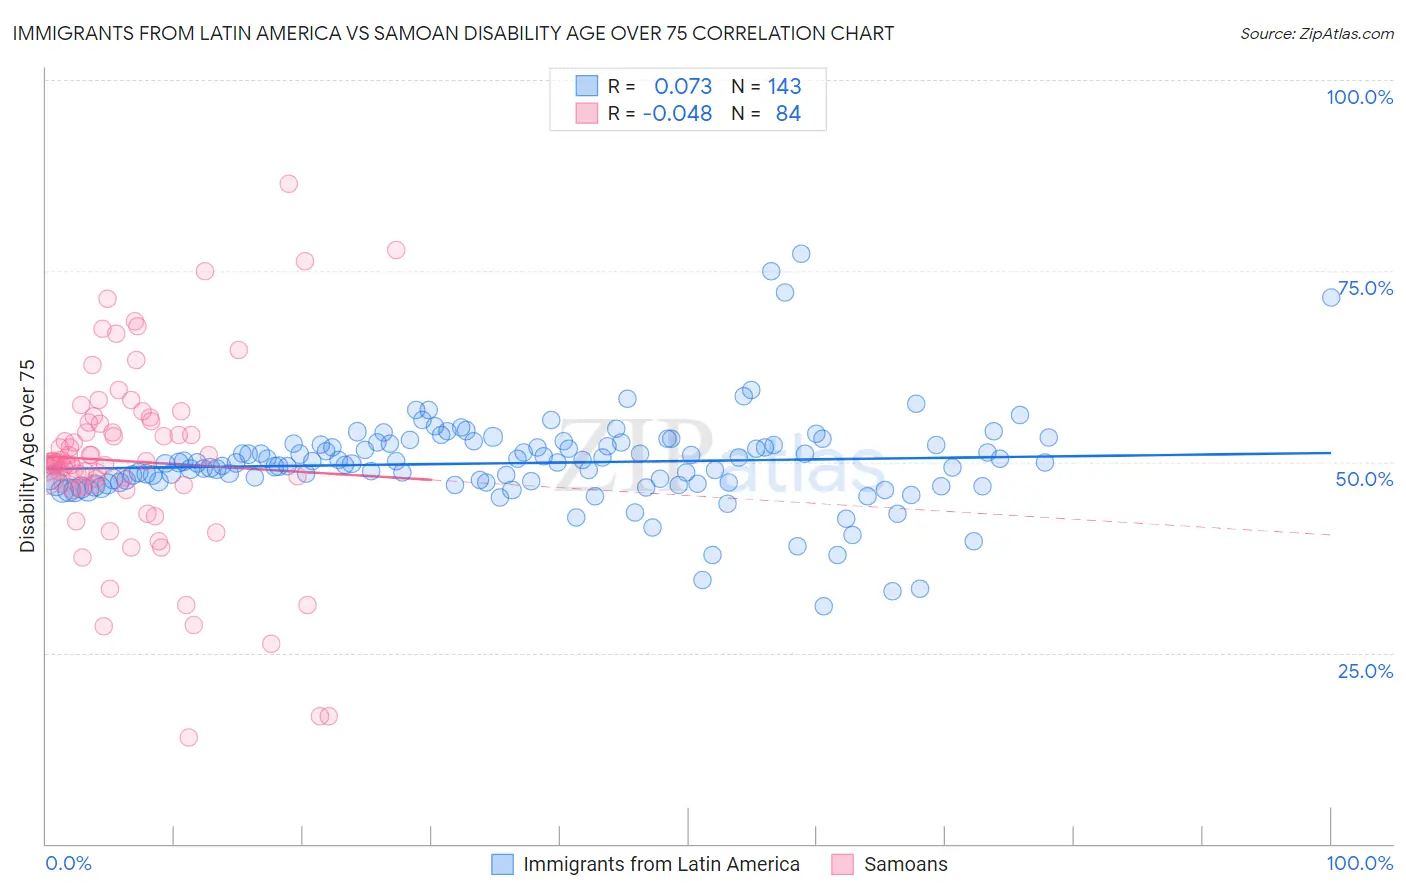
Immigrants from Latin America vs Samoan Disability Age Over 75 Correlation Chart
The statistical analysis conducted on geographies consisting of 556,620,542 people shows a slight positive correlation between the proportion of Immigrants from Latin America and percentage of population with a disability over the age of 75 in the United States with a correlation coefficient (R) of 0.073 and weighted average of 49.5%. Similarly, the statistical analysis conducted on geographies consisting of 224,696,097 people shows no correlation between the proportion of Samoans and percentage of population with a disability over the age of 75 in the United States with a correlation coefficient (R) of -0.048 and weighted average of 49.5%, a difference of 0.050%.
Disability Age Over 75 Correlation Summary
| Measurement | Immigrants from Latin America | Samoan |
| Minimum | 31.1% | 14.0% |
| Maximum | 77.2% | 86.4% |
| Range | 46.1% | 72.4% |
| Mean | 49.8% | 50.1% |
| Median | 49.8% | 49.9% |
| Interquartile 25% (IQ1) | 47.2% | 46.7% |
| Interquartile 75% (IQ3) | 52.3% | 55.2% |
| Interquartile Range (IQR) | 5.1% | 8.4% |
| Standard Deviation (Sample) | 6.3% | 12.6% |
| Standard Deviation (Population) | 6.2% | 12.5% |
Demographics Similar to Immigrants from Latin America and Samoans by Disability Age Over 75
In terms of disability age over 75, the demographic groups most similar to Immigrants from Latin America are Black/African American (49.5%, a difference of 0.080%), Crow (49.6%, a difference of 0.13%), Belizean (49.4%, a difference of 0.22%), Immigrants from Belize (49.6%, a difference of 0.22%), and Bangladeshi (49.4%, a difference of 0.23%). Similarly, the demographic groups most similar to Samoans are Black/African American (49.5%, a difference of 0.030%), Bangladeshi (49.4%, a difference of 0.17%), Belizean (49.4%, a difference of 0.17%), Crow (49.6%, a difference of 0.19%), and Guamanian/Chamorro (49.4%, a difference of 0.24%).
| Demographics | Rating | Rank | Disability Age Over 75 |
| Immigrants | Iraq | 0.1 /100 | #273 | Tragic 49.1% |
| Immigrants | Guatemala | 0.1 /100 | #274 | Tragic 49.1% |
| Immigrants | Dominica | 0.1 /100 | #275 | Tragic 49.1% |
| Immigrants | Uzbekistan | 0.1 /100 | #276 | Tragic 49.2% |
| Hawaiians | 0.1 /100 | #277 | Tragic 49.2% |
| Immigrants | Laos | 0.1 /100 | #278 | Tragic 49.2% |
| Guamanians/Chamorros | 0.0 /100 | #279 | Tragic 49.4% |
| Bangladeshis | 0.0 /100 | #280 | Tragic 49.4% |
| Belizeans | 0.0 /100 | #281 | Tragic 49.4% |
| Blacks/African Americans | 0.0 /100 | #282 | Tragic 49.5% |
| Samoans | 0.0 /100 | #283 | Tragic 49.5% |
| Immigrants | Latin America | 0.0 /100 | #284 | Tragic 49.5% |
| Crow | 0.0 /100 | #285 | Tragic 49.6% |
| Immigrants | Belize | 0.0 /100 | #286 | Tragic 49.6% |
| Sioux | 0.0 /100 | #287 | Tragic 49.7% |
| Yaqui | 0.0 /100 | #288 | Tragic 49.8% |
| Osage | 0.0 /100 | #289 | Tragic 49.8% |
| Puget Sound Salish | 0.0 /100 | #290 | Tragic 49.8% |
| Arapaho | 0.0 /100 | #291 | Tragic 49.8% |
| Shoshone | 0.0 /100 | #292 | Tragic 49.9% |
| Spanish American Indians | 0.0 /100 | #293 | Tragic 49.9% |