Immigrants from Latin America vs Bolivian Vision Disability
COMPARE
Immigrants from Latin America
Bolivian
Vision Disability
Vision Disability Comparison
Immigrants from Latin America
Bolivians
2.4%
VISION DISABILITY
0.0/ 100
METRIC RATING
274th/ 347
METRIC RANK
1.9%
VISION DISABILITY
100.0/ 100
METRIC RATING
18th/ 347
METRIC RANK
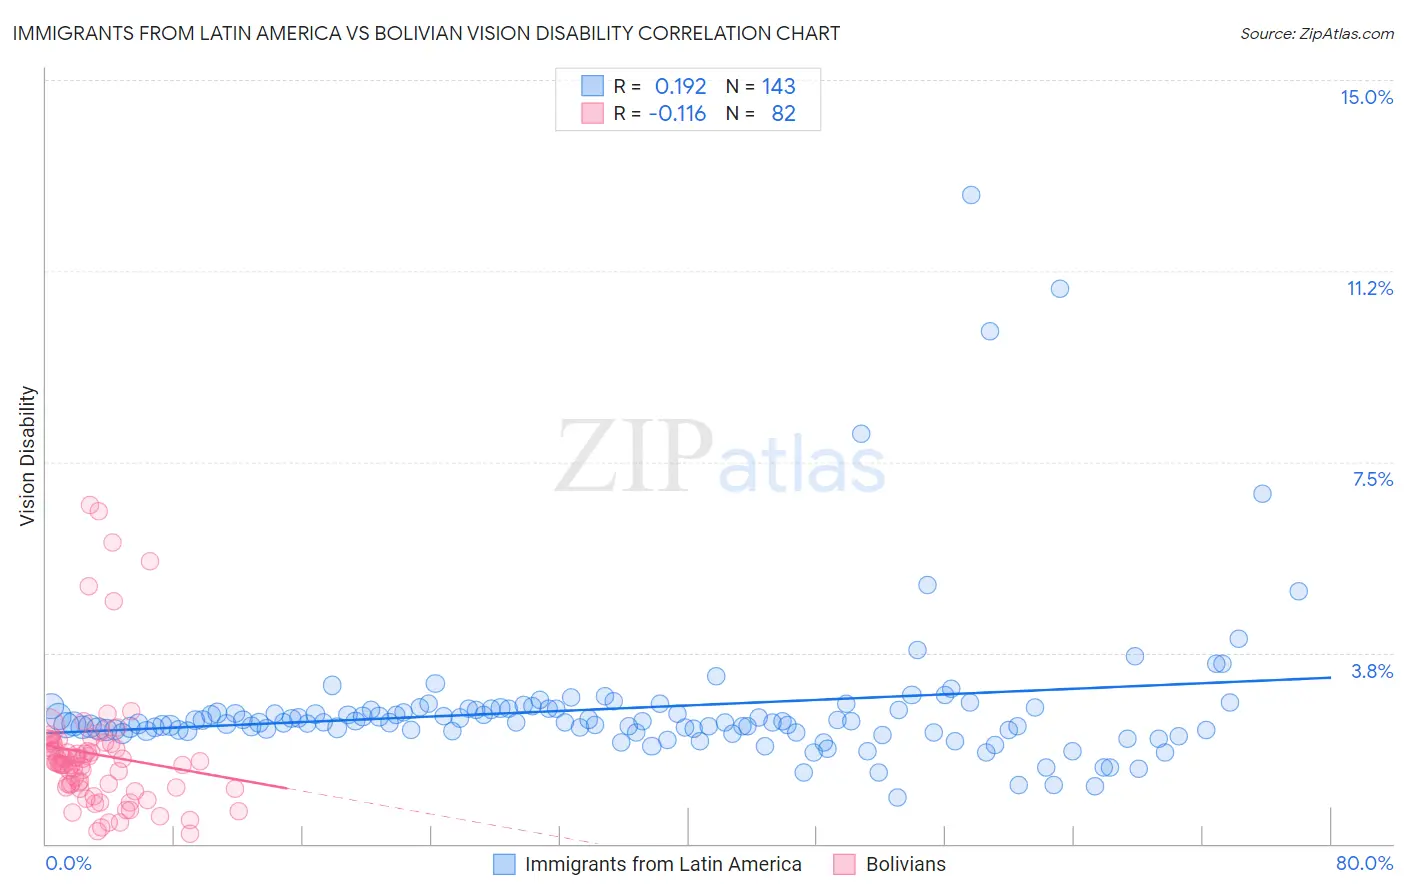
Immigrants from Latin America vs Bolivian Vision Disability Correlation Chart
The statistical analysis conducted on geographies consisting of 557,074,297 people shows a poor positive correlation between the proportion of Immigrants from Latin America and percentage of population with vision disability in the United States with a correlation coefficient (R) of 0.192 and weighted average of 2.4%. Similarly, the statistical analysis conducted on geographies consisting of 184,625,860 people shows a poor negative correlation between the proportion of Bolivians and percentage of population with vision disability in the United States with a correlation coefficient (R) of -0.116 and weighted average of 1.9%, a difference of 30.8%.
Vision Disability Correlation Summary
| Measurement | Immigrants from Latin America | Bolivian |
| Minimum | 0.90% | 0.21% |
| Maximum | 12.7% | 6.7% |
| Range | 11.8% | 6.4% |
| Mean | 2.7% | 1.8% |
| Median | 2.4% | 1.6% |
| Interquartile 25% (IQ1) | 2.2% | 1.1% |
| Interquartile 75% (IQ3) | 2.7% | 2.0% |
| Interquartile Range (IQR) | 0.43% | 0.85% |
| Standard Deviation (Sample) | 1.5% | 1.3% |
| Standard Deviation (Population) | 1.5% | 1.3% |
Similar Demographics by Vision Disability
Demographics Similar to Immigrants from Latin America by Vision Disability
In terms of vision disability, the demographic groups most similar to Immigrants from Latin America are Immigrants from Bahamas (2.4%, a difference of 0.31%), Chippewa (2.4%, a difference of 0.32%), Scotch-Irish (2.4%, a difference of 0.41%), Bahamian (2.4%, a difference of 0.45%), and Spanish (2.4%, a difference of 0.61%).
| Demographics | Rating | Rank | Vision Disability |
| Ute | 0.1 /100 | #267 | Tragic 2.4% |
| Senegalese | 0.1 /100 | #268 | Tragic 2.4% |
| Celtics | 0.1 /100 | #269 | Tragic 2.4% |
| Cubans | 0.1 /100 | #270 | Tragic 2.4% |
| Immigrants | Azores | 0.1 /100 | #271 | Tragic 2.4% |
| Spaniards | 0.1 /100 | #272 | Tragic 2.4% |
| Immigrants | Bahamas | 0.1 /100 | #273 | Tragic 2.4% |
| Immigrants | Latin America | 0.0 /100 | #274 | Tragic 2.4% |
| Chippewa | 0.0 /100 | #275 | Tragic 2.4% |
| Scotch-Irish | 0.0 /100 | #276 | Tragic 2.4% |
| Bahamians | 0.0 /100 | #277 | Tragic 2.4% |
| Spanish | 0.0 /100 | #278 | Tragic 2.4% |
| Nepalese | 0.0 /100 | #279 | Tragic 2.4% |
| Cape Verdeans | 0.0 /100 | #280 | Tragic 2.4% |
| U.S. Virgin Islanders | 0.0 /100 | #281 | Tragic 2.5% |
Demographics Similar to Bolivians by Vision Disability
In terms of vision disability, the demographic groups most similar to Bolivians are Indian (Asian) (1.8%, a difference of 0.42%), Burmese (1.8%, a difference of 0.42%), Immigrants from Bolivia (1.8%, a difference of 0.87%), Immigrants from Sri Lanka (1.9%, a difference of 1.2%), and Immigrants from China (1.8%, a difference of 1.3%).
| Demographics | Rating | Rank | Vision Disability |
| Immigrants | Israel | 100.0 /100 | #11 | Exceptional 1.8% |
| Immigrants | Korea | 100.0 /100 | #12 | Exceptional 1.8% |
| Immigrants | Eastern Asia | 100.0 /100 | #13 | Exceptional 1.8% |
| Immigrants | China | 100.0 /100 | #14 | Exceptional 1.8% |
| Immigrants | Bolivia | 100.0 /100 | #15 | Exceptional 1.8% |
| Indians (Asian) | 100.0 /100 | #16 | Exceptional 1.8% |
| Burmese | 100.0 /100 | #17 | Exceptional 1.8% |
| Bolivians | 100.0 /100 | #18 | Exceptional 1.9% |
| Immigrants | Sri Lanka | 100.0 /100 | #19 | Exceptional 1.9% |
| Asians | 100.0 /100 | #20 | Exceptional 1.9% |
| Turks | 100.0 /100 | #21 | Exceptional 1.9% |
| Immigrants | Pakistan | 100.0 /100 | #22 | Exceptional 1.9% |
| Immigrants | Asia | 99.9 /100 | #23 | Exceptional 1.9% |
| Immigrants | Lithuania | 99.9 /100 | #24 | Exceptional 1.9% |
| Bulgarians | 99.9 /100 | #25 | Exceptional 1.9% |