Immigrants from Laos vs Yaqui Disability Age Over 75
COMPARE
Immigrants from Laos
Yaqui
Disability Age Over 75
Disability Age Over 75 Comparison
Immigrants from Laos
Yaqui
49.2%
DISABILITY AGE OVER 75
0.1/ 100
METRIC RATING
278th/ 347
METRIC RANK
49.8%
DISABILITY AGE OVER 75
0.0/ 100
METRIC RATING
288th/ 347
METRIC RANK
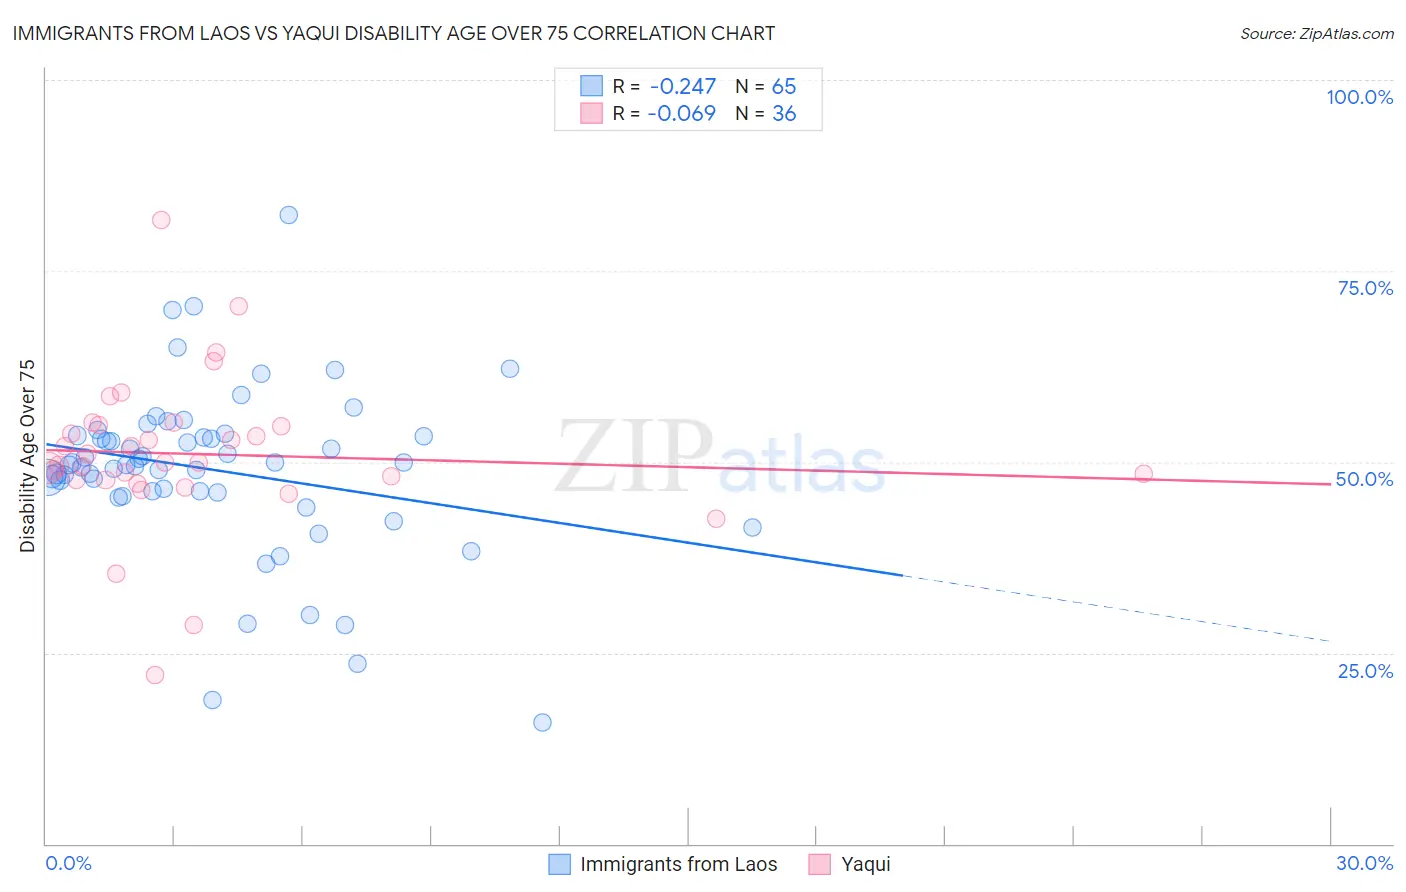
Immigrants from Laos vs Yaqui Disability Age Over 75 Correlation Chart
The statistical analysis conducted on geographies consisting of 201,421,107 people shows a weak negative correlation between the proportion of Immigrants from Laos and percentage of population with a disability over the age of 75 in the United States with a correlation coefficient (R) of -0.247 and weighted average of 49.2%. Similarly, the statistical analysis conducted on geographies consisting of 107,650,566 people shows a slight negative correlation between the proportion of Yaqui and percentage of population with a disability over the age of 75 in the United States with a correlation coefficient (R) of -0.069 and weighted average of 49.8%, a difference of 1.2%.
Disability Age Over 75 Correlation Summary
| Measurement | Immigrants from Laos | Yaqui |
| Minimum | 15.9% | 22.1% |
| Maximum | 82.4% | 81.7% |
| Range | 66.5% | 59.5% |
| Mean | 49.0% | 51.0% |
| Median | 49.7% | 50.0% |
| Interquartile 25% (IQ1) | 46.1% | 47.6% |
| Interquartile 75% (IQ3) | 53.4% | 54.8% |
| Interquartile Range (IQR) | 7.3% | 7.1% |
| Standard Deviation (Sample) | 11.0% | 10.2% |
| Standard Deviation (Population) | 10.9% | 10.1% |
Demographics Similar to Immigrants from Laos and Yaqui by Disability Age Over 75
In terms of disability age over 75, the demographic groups most similar to Immigrants from Laos are Hawaiian (49.2%, a difference of 0.030%), Immigrants from Uzbekistan (49.2%, a difference of 0.060%), Immigrants from Dominica (49.1%, a difference of 0.17%), Immigrants from Guatemala (49.1%, a difference of 0.18%), and Immigrants from Iraq (49.1%, a difference of 0.26%). Similarly, the demographic groups most similar to Yaqui are Sioux (49.7%, a difference of 0.050%), Osage (49.8%, a difference of 0.080%), Puget Sound Salish (49.8%, a difference of 0.090%), Arapaho (49.8%, a difference of 0.090%), and Shoshone (49.9%, a difference of 0.16%).
| Demographics | Rating | Rank | Disability Age Over 75 |
| Immigrants | Iraq | 0.1 /100 | #273 | Tragic 49.1% |
| Immigrants | Guatemala | 0.1 /100 | #274 | Tragic 49.1% |
| Immigrants | Dominica | 0.1 /100 | #275 | Tragic 49.1% |
| Immigrants | Uzbekistan | 0.1 /100 | #276 | Tragic 49.2% |
| Hawaiians | 0.1 /100 | #277 | Tragic 49.2% |
| Immigrants | Laos | 0.1 /100 | #278 | Tragic 49.2% |
| Guamanians/Chamorros | 0.0 /100 | #279 | Tragic 49.4% |
| Bangladeshis | 0.0 /100 | #280 | Tragic 49.4% |
| Belizeans | 0.0 /100 | #281 | Tragic 49.4% |
| Blacks/African Americans | 0.0 /100 | #282 | Tragic 49.5% |
| Samoans | 0.0 /100 | #283 | Tragic 49.5% |
| Immigrants | Latin America | 0.0 /100 | #284 | Tragic 49.5% |
| Crow | 0.0 /100 | #285 | Tragic 49.6% |
| Immigrants | Belize | 0.0 /100 | #286 | Tragic 49.6% |
| Sioux | 0.0 /100 | #287 | Tragic 49.7% |
| Yaqui | 0.0 /100 | #288 | Tragic 49.8% |
| Osage | 0.0 /100 | #289 | Tragic 49.8% |
| Puget Sound Salish | 0.0 /100 | #290 | Tragic 49.8% |
| Arapaho | 0.0 /100 | #291 | Tragic 49.8% |
| Shoshone | 0.0 /100 | #292 | Tragic 49.9% |
| Spanish American Indians | 0.0 /100 | #293 | Tragic 49.9% |