Immigrants from Saudi Arabia vs Yaqui Disability Age Over 75
COMPARE
Immigrants from Saudi Arabia
Yaqui
Disability Age Over 75
Disability Age Over 75 Comparison
Immigrants from Saudi Arabia
Yaqui
46.3%
DISABILITY AGE OVER 75
98.4/ 100
METRIC RATING
89th/ 347
METRIC RANK
49.8%
DISABILITY AGE OVER 75
0.0/ 100
METRIC RATING
288th/ 347
METRIC RANK
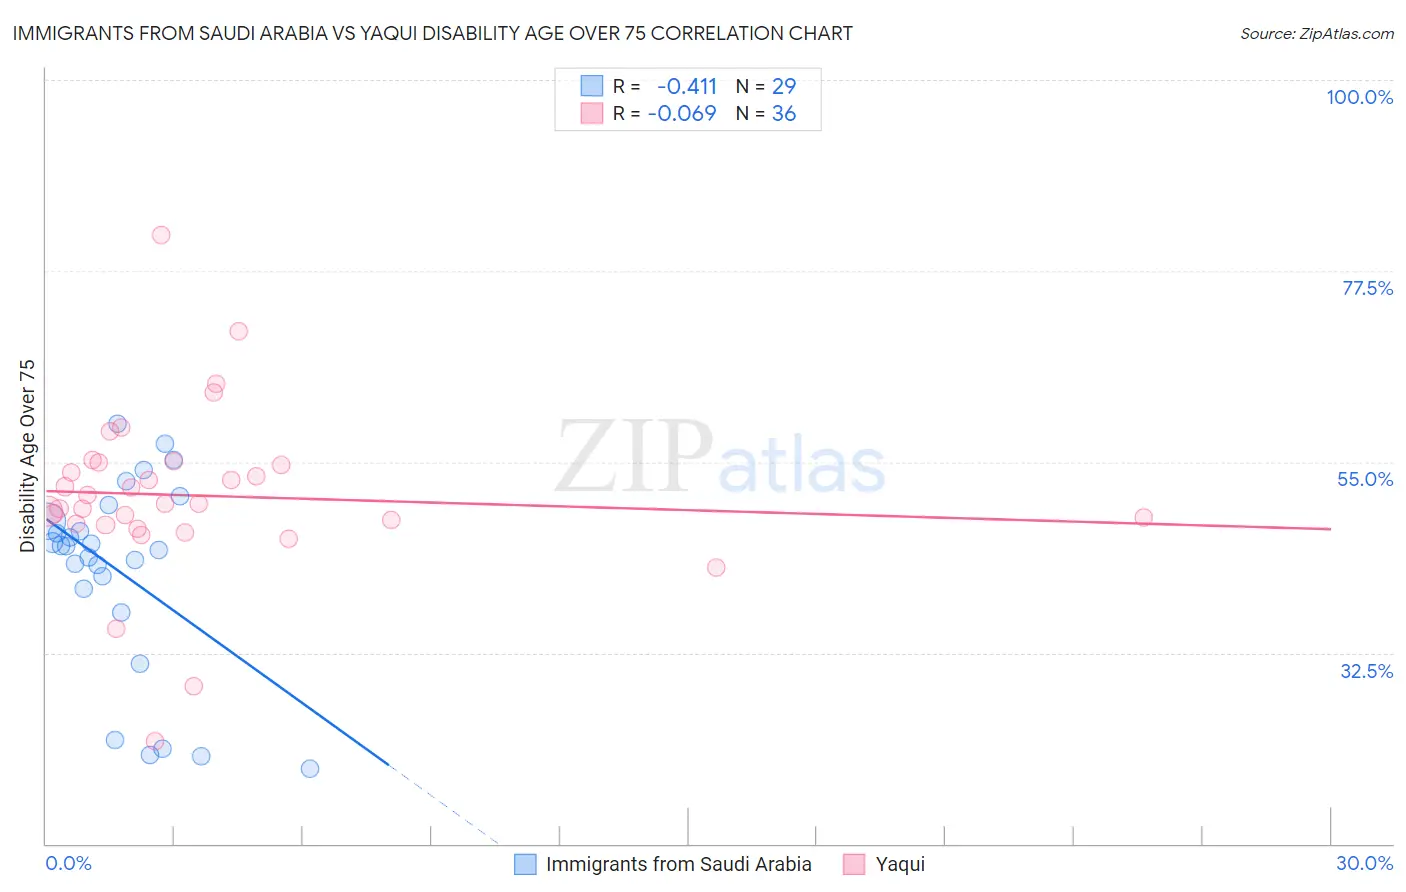
Immigrants from Saudi Arabia vs Yaqui Disability Age Over 75 Correlation Chart
The statistical analysis conducted on geographies consisting of 164,150,377 people shows a moderate negative correlation between the proportion of Immigrants from Saudi Arabia and percentage of population with a disability over the age of 75 in the United States with a correlation coefficient (R) of -0.411 and weighted average of 46.3%. Similarly, the statistical analysis conducted on geographies consisting of 107,650,566 people shows a slight negative correlation between the proportion of Yaqui and percentage of population with a disability over the age of 75 in the United States with a correlation coefficient (R) of -0.069 and weighted average of 49.8%, a difference of 7.6%.
Disability Age Over 75 Correlation Summary
| Measurement | Immigrants from Saudi Arabia | Yaqui |
| Minimum | 18.9% | 22.1% |
| Maximum | 59.5% | 81.7% |
| Range | 40.7% | 59.5% |
| Mean | 42.0% | 51.0% |
| Median | 45.1% | 50.0% |
| Interquartile 25% (IQ1) | 38.6% | 47.6% |
| Interquartile 75% (IQ3) | 49.0% | 54.8% |
| Interquartile Range (IQR) | 10.3% | 7.1% |
| Standard Deviation (Sample) | 11.5% | 10.2% |
| Standard Deviation (Population) | 11.3% | 10.1% |
Similar Demographics by Disability Age Over 75
Demographics Similar to Immigrants from Saudi Arabia by Disability Age Over 75
In terms of disability age over 75, the demographic groups most similar to Immigrants from Saudi Arabia are Uruguayan (46.2%, a difference of 0.010%), Northern European (46.3%, a difference of 0.010%), Immigrants from Egypt (46.3%, a difference of 0.020%), German (46.3%, a difference of 0.070%), and Ugandan (46.3%, a difference of 0.070%).
| Demographics | Rating | Rank | Disability Age Over 75 |
| Immigrants | Latvia | 98.7 /100 | #82 | Exceptional 46.2% |
| Argentineans | 98.7 /100 | #83 | Exceptional 46.2% |
| Immigrants | Jordan | 98.7 /100 | #84 | Exceptional 46.2% |
| Immigrants | Southern Europe | 98.6 /100 | #85 | Exceptional 46.2% |
| Romanians | 98.6 /100 | #86 | Exceptional 46.2% |
| Danes | 98.6 /100 | #87 | Exceptional 46.2% |
| Uruguayans | 98.4 /100 | #88 | Exceptional 46.2% |
| Immigrants | Saudi Arabia | 98.4 /100 | #89 | Exceptional 46.3% |
| Northern Europeans | 98.3 /100 | #90 | Exceptional 46.3% |
| Immigrants | Egypt | 98.3 /100 | #91 | Exceptional 46.3% |
| Germans | 98.2 /100 | #92 | Exceptional 46.3% |
| Ugandans | 98.2 /100 | #93 | Exceptional 46.3% |
| Albanians | 98.1 /100 | #94 | Exceptional 46.3% |
| Immigrants | Brazil | 98.0 /100 | #95 | Exceptional 46.3% |
| Immigrants | China | 98.0 /100 | #96 | Exceptional 46.3% |
Demographics Similar to Yaqui by Disability Age Over 75
In terms of disability age over 75, the demographic groups most similar to Yaqui are Sioux (49.7%, a difference of 0.050%), Osage (49.8%, a difference of 0.080%), Puget Sound Salish (49.8%, a difference of 0.090%), Arapaho (49.8%, a difference of 0.090%), and Shoshone (49.9%, a difference of 0.16%).
| Demographics | Rating | Rank | Disability Age Over 75 |
| Belizeans | 0.0 /100 | #281 | Tragic 49.4% |
| Blacks/African Americans | 0.0 /100 | #282 | Tragic 49.5% |
| Samoans | 0.0 /100 | #283 | Tragic 49.5% |
| Immigrants | Latin America | 0.0 /100 | #284 | Tragic 49.5% |
| Crow | 0.0 /100 | #285 | Tragic 49.6% |
| Immigrants | Belize | 0.0 /100 | #286 | Tragic 49.6% |
| Sioux | 0.0 /100 | #287 | Tragic 49.7% |
| Yaqui | 0.0 /100 | #288 | Tragic 49.8% |
| Osage | 0.0 /100 | #289 | Tragic 49.8% |
| Puget Sound Salish | 0.0 /100 | #290 | Tragic 49.8% |
| Arapaho | 0.0 /100 | #291 | Tragic 49.8% |
| Shoshone | 0.0 /100 | #292 | Tragic 49.9% |
| Spanish American Indians | 0.0 /100 | #293 | Tragic 49.9% |
| Immigrants | Cambodia | 0.0 /100 | #294 | Tragic 50.0% |
| Spanish Americans | 0.0 /100 | #295 | Tragic 50.0% |