Immigrants from Laos vs Immigrants from Malaysia Disability Age Over 75
COMPARE
Immigrants from Laos
Immigrants from Malaysia
Disability Age Over 75
Disability Age Over 75 Comparison
Immigrants from Laos
Immigrants from Malaysia
49.2%
DISABILITY AGE OVER 75
0.1/ 100
METRIC RATING
278th/ 347
METRIC RANK
46.4%
DISABILITY AGE OVER 75
97.1/ 100
METRIC RATING
102nd/ 347
METRIC RANK
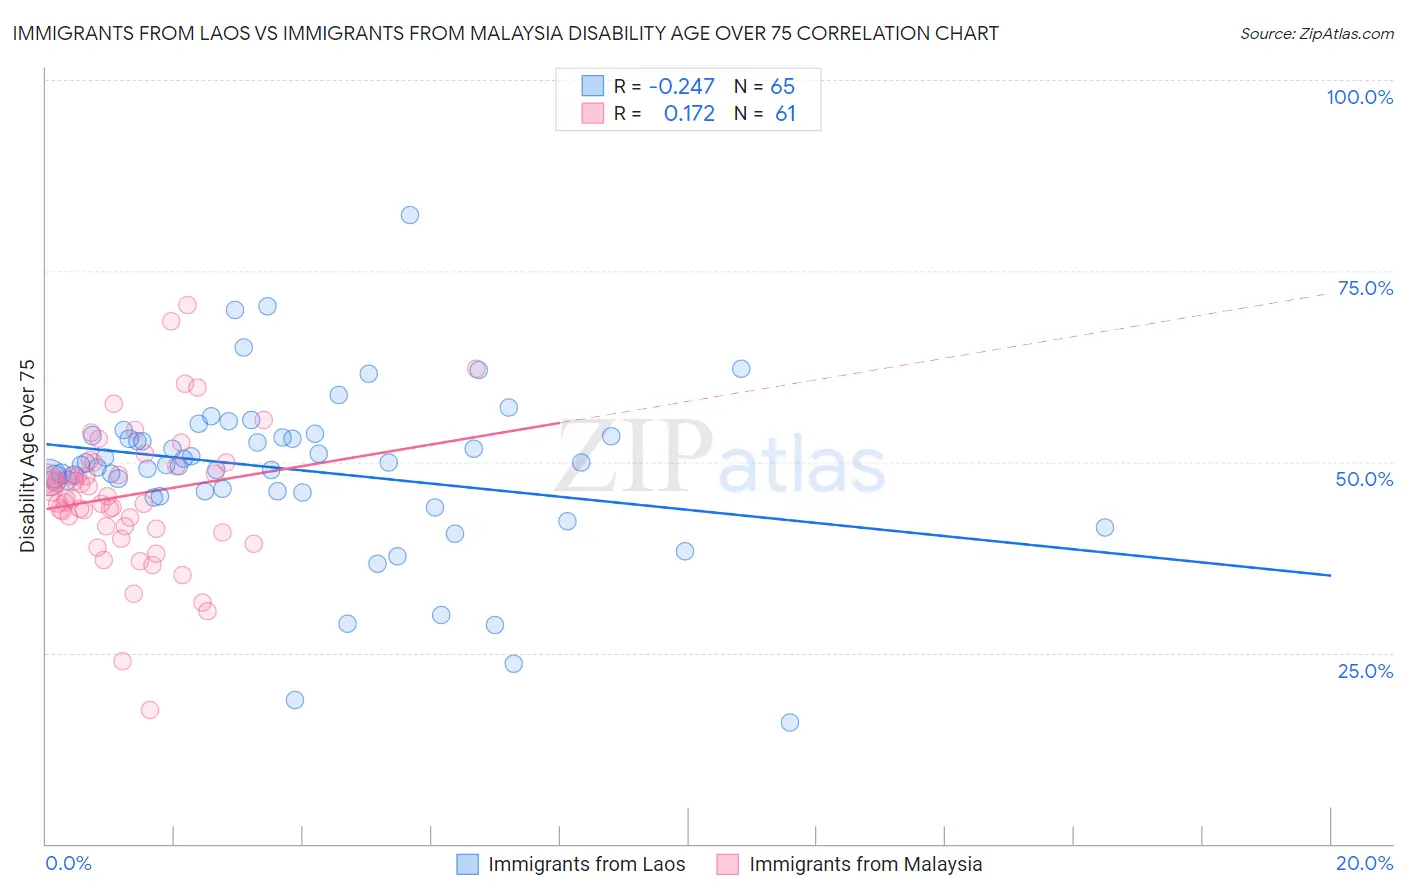
Immigrants from Laos vs Immigrants from Malaysia Disability Age Over 75 Correlation Chart
The statistical analysis conducted on geographies consisting of 201,421,107 people shows a weak negative correlation between the proportion of Immigrants from Laos and percentage of population with a disability over the age of 75 in the United States with a correlation coefficient (R) of -0.247 and weighted average of 49.2%. Similarly, the statistical analysis conducted on geographies consisting of 197,852,473 people shows a poor positive correlation between the proportion of Immigrants from Malaysia and percentage of population with a disability over the age of 75 in the United States with a correlation coefficient (R) of 0.172 and weighted average of 46.4%, a difference of 6.0%.
Disability Age Over 75 Correlation Summary
| Measurement | Immigrants from Laos | Immigrants from Malaysia |
| Minimum | 15.9% | 17.5% |
| Maximum | 82.4% | 70.6% |
| Range | 66.5% | 53.1% |
| Mean | 49.0% | 45.6% |
| Median | 49.7% | 45.2% |
| Interquartile 25% (IQ1) | 46.1% | 41.4% |
| Interquartile 75% (IQ3) | 53.4% | 49.7% |
| Interquartile Range (IQR) | 7.3% | 8.3% |
| Standard Deviation (Sample) | 11.0% | 9.1% |
| Standard Deviation (Population) | 10.9% | 9.0% |
Similar Demographics by Disability Age Over 75
Demographics Similar to Immigrants from Laos by Disability Age Over 75
In terms of disability age over 75, the demographic groups most similar to Immigrants from Laos are Hawaiian (49.2%, a difference of 0.030%), Immigrants from Uzbekistan (49.2%, a difference of 0.060%), Immigrants from Dominica (49.1%, a difference of 0.17%), Immigrants from Guatemala (49.1%, a difference of 0.18%), and Immigrants from Iraq (49.1%, a difference of 0.26%).
| Demographics | Rating | Rank | Disability Age Over 75 |
| Fijians | 0.2 /100 | #271 | Tragic 49.0% |
| Assyrians/Chaldeans/Syriacs | 0.2 /100 | #272 | Tragic 49.1% |
| Immigrants | Iraq | 0.1 /100 | #273 | Tragic 49.1% |
| Immigrants | Guatemala | 0.1 /100 | #274 | Tragic 49.1% |
| Immigrants | Dominica | 0.1 /100 | #275 | Tragic 49.1% |
| Immigrants | Uzbekistan | 0.1 /100 | #276 | Tragic 49.2% |
| Hawaiians | 0.1 /100 | #277 | Tragic 49.2% |
| Immigrants | Laos | 0.1 /100 | #278 | Tragic 49.2% |
| Guamanians/Chamorros | 0.0 /100 | #279 | Tragic 49.4% |
| Bangladeshis | 0.0 /100 | #280 | Tragic 49.4% |
| Belizeans | 0.0 /100 | #281 | Tragic 49.4% |
| Blacks/African Americans | 0.0 /100 | #282 | Tragic 49.5% |
| Samoans | 0.0 /100 | #283 | Tragic 49.5% |
| Immigrants | Latin America | 0.0 /100 | #284 | Tragic 49.5% |
| Crow | 0.0 /100 | #285 | Tragic 49.6% |
Demographics Similar to Immigrants from Malaysia by Disability Age Over 75
In terms of disability age over 75, the demographic groups most similar to Immigrants from Malaysia are Ukrainian (46.4%, a difference of 0.010%), Israeli (46.4%, a difference of 0.020%), Immigrants from Cameroon (46.4%, a difference of 0.050%), Immigrants from Kuwait (46.4%, a difference of 0.060%), and Immigrants from Uruguay (46.4%, a difference of 0.090%).
| Demographics | Rating | Rank | Disability Age Over 75 |
| Immigrants | Brazil | 98.0 /100 | #95 | Exceptional 46.3% |
| Immigrants | China | 98.0 /100 | #96 | Exceptional 46.3% |
| Finns | 97.9 /100 | #97 | Exceptional 46.3% |
| Immigrants | Japan | 97.8 /100 | #98 | Exceptional 46.3% |
| Palestinians | 97.7 /100 | #99 | Exceptional 46.3% |
| Immigrants | Eastern Europe | 97.7 /100 | #100 | Exceptional 46.3% |
| Mongolians | 97.7 /100 | #101 | Exceptional 46.3% |
| Immigrants | Malaysia | 97.1 /100 | #102 | Exceptional 46.4% |
| Ukrainians | 97.1 /100 | #103 | Exceptional 46.4% |
| Israelis | 97.0 /100 | #104 | Exceptional 46.4% |
| Immigrants | Cameroon | 96.9 /100 | #105 | Exceptional 46.4% |
| Immigrants | Kuwait | 96.8 /100 | #106 | Exceptional 46.4% |
| Immigrants | Uruguay | 96.7 /100 | #107 | Exceptional 46.4% |
| Brazilians | 96.6 /100 | #108 | Exceptional 46.5% |
| Chileans | 96.4 /100 | #109 | Exceptional 46.5% |