Immigrants from Greece vs Yaqui Disability Age Over 75
COMPARE
Immigrants from Greece
Yaqui
Disability Age Over 75
Disability Age Over 75 Comparison
Immigrants from Greece
Yaqui
45.2%
DISABILITY AGE OVER 75
100.0/ 100
METRIC RATING
19th/ 347
METRIC RANK
49.8%
DISABILITY AGE OVER 75
0.0/ 100
METRIC RATING
288th/ 347
METRIC RANK
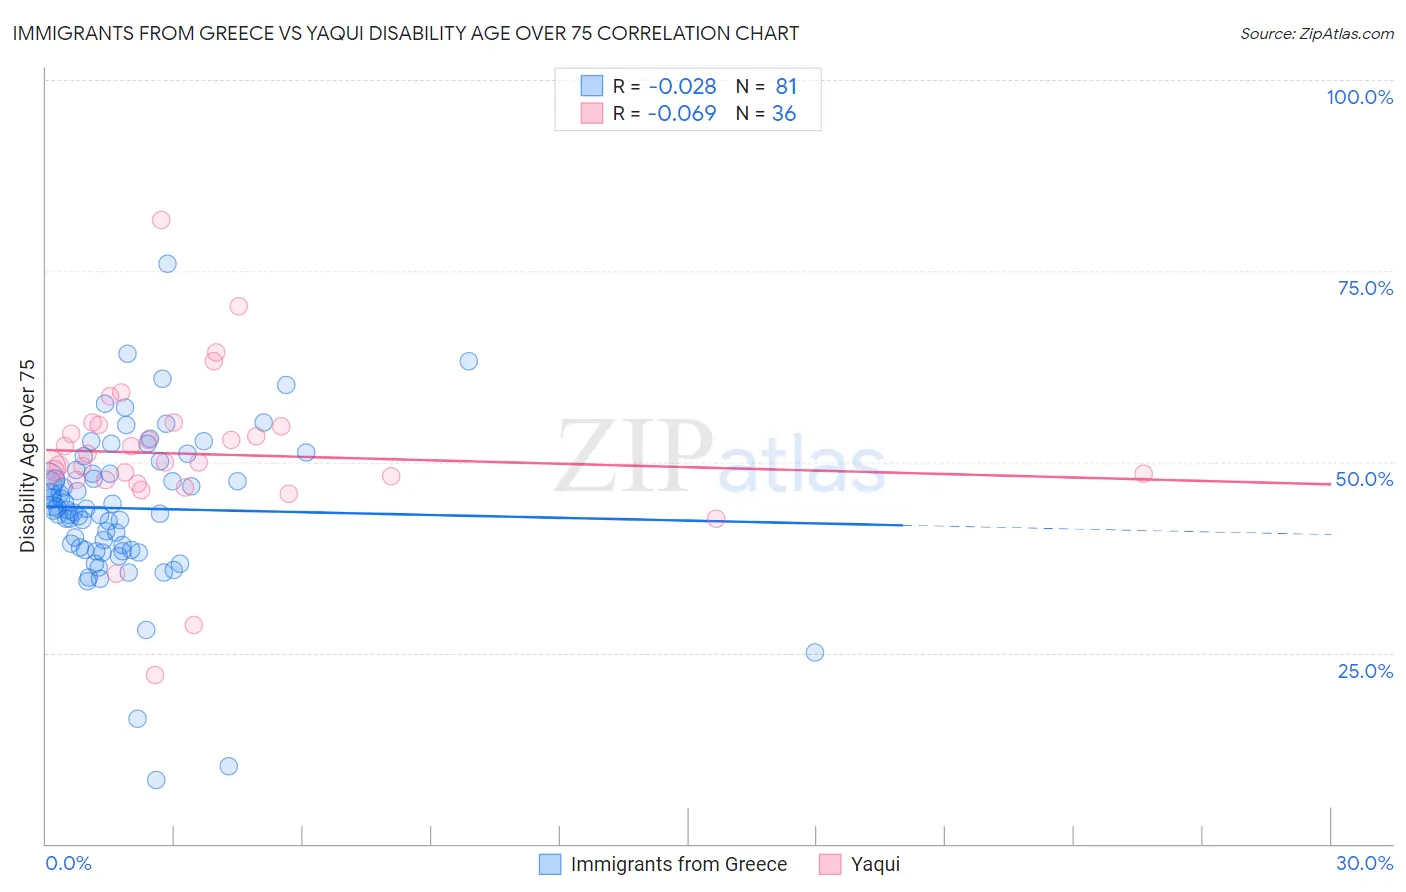
Immigrants from Greece vs Yaqui Disability Age Over 75 Correlation Chart
The statistical analysis conducted on geographies consisting of 216,798,152 people shows no correlation between the proportion of Immigrants from Greece and percentage of population with a disability over the age of 75 in the United States with a correlation coefficient (R) of -0.028 and weighted average of 45.2%. Similarly, the statistical analysis conducted on geographies consisting of 107,650,566 people shows a slight negative correlation between the proportion of Yaqui and percentage of population with a disability over the age of 75 in the United States with a correlation coefficient (R) of -0.069 and weighted average of 49.8%, a difference of 10.1%.
Disability Age Over 75 Correlation Summary
| Measurement | Immigrants from Greece | Yaqui |
| Minimum | 8.3% | 22.1% |
| Maximum | 75.9% | 81.7% |
| Range | 67.5% | 59.5% |
| Mean | 43.9% | 51.0% |
| Median | 43.8% | 50.0% |
| Interquartile 25% (IQ1) | 38.5% | 47.6% |
| Interquartile 75% (IQ3) | 48.6% | 54.8% |
| Interquartile Range (IQR) | 10.2% | 7.1% |
| Standard Deviation (Sample) | 10.4% | 10.2% |
| Standard Deviation (Population) | 10.3% | 10.1% |
Similar Demographics by Disability Age Over 75
Demographics Similar to Immigrants from Greece by Disability Age Over 75
In terms of disability age over 75, the demographic groups most similar to Immigrants from Greece are Bolivian (45.2%, a difference of 0.010%), Immigrants from India (45.2%, a difference of 0.030%), Immigrants from Northern Europe (45.2%, a difference of 0.040%), Immigrants from Serbia (45.3%, a difference of 0.11%), and Immigrants from Sweden (45.1%, a difference of 0.14%).
| Demographics | Rating | Rank | Disability Age Over 75 |
| Immigrants | Czechoslovakia | 100.0 /100 | #12 | Exceptional 45.1% |
| Latvians | 100.0 /100 | #13 | Exceptional 45.1% |
| Immigrants | Scotland | 100.0 /100 | #14 | Exceptional 45.1% |
| Immigrants | Sweden | 100.0 /100 | #15 | Exceptional 45.1% |
| Immigrants | Northern Europe | 100.0 /100 | #16 | Exceptional 45.2% |
| Immigrants | India | 100.0 /100 | #17 | Exceptional 45.2% |
| Bolivians | 100.0 /100 | #18 | Exceptional 45.2% |
| Immigrants | Greece | 100.0 /100 | #19 | Exceptional 45.2% |
| Immigrants | Serbia | 100.0 /100 | #20 | Exceptional 45.3% |
| Immigrants | Belgium | 100.0 /100 | #21 | Exceptional 45.3% |
| Immigrants | South Africa | 100.0 /100 | #22 | Exceptional 45.3% |
| Immigrants | Switzerland | 99.9 /100 | #23 | Exceptional 45.3% |
| Poles | 99.9 /100 | #24 | Exceptional 45.3% |
| Immigrants | Bolivia | 99.9 /100 | #25 | Exceptional 45.4% |
| Macedonians | 99.9 /100 | #26 | Exceptional 45.4% |
Demographics Similar to Yaqui by Disability Age Over 75
In terms of disability age over 75, the demographic groups most similar to Yaqui are Sioux (49.7%, a difference of 0.050%), Osage (49.8%, a difference of 0.080%), Puget Sound Salish (49.8%, a difference of 0.090%), Arapaho (49.8%, a difference of 0.090%), and Shoshone (49.9%, a difference of 0.16%).
| Demographics | Rating | Rank | Disability Age Over 75 |
| Belizeans | 0.0 /100 | #281 | Tragic 49.4% |
| Blacks/African Americans | 0.0 /100 | #282 | Tragic 49.5% |
| Samoans | 0.0 /100 | #283 | Tragic 49.5% |
| Immigrants | Latin America | 0.0 /100 | #284 | Tragic 49.5% |
| Crow | 0.0 /100 | #285 | Tragic 49.6% |
| Immigrants | Belize | 0.0 /100 | #286 | Tragic 49.6% |
| Sioux | 0.0 /100 | #287 | Tragic 49.7% |
| Yaqui | 0.0 /100 | #288 | Tragic 49.8% |
| Osage | 0.0 /100 | #289 | Tragic 49.8% |
| Puget Sound Salish | 0.0 /100 | #290 | Tragic 49.8% |
| Arapaho | 0.0 /100 | #291 | Tragic 49.8% |
| Shoshone | 0.0 /100 | #292 | Tragic 49.9% |
| Spanish American Indians | 0.0 /100 | #293 | Tragic 49.9% |
| Immigrants | Cambodia | 0.0 /100 | #294 | Tragic 50.0% |
| Spanish Americans | 0.0 /100 | #295 | Tragic 50.0% |