Immigrants from Croatia vs Yaqui Disability Age Over 75
COMPARE
Immigrants from Croatia
Yaqui
Disability Age Over 75
Disability Age Over 75 Comparison
Immigrants from Croatia
Yaqui
45.5%
DISABILITY AGE OVER 75
99.9/ 100
METRIC RATING
33rd/ 347
METRIC RANK
49.8%
DISABILITY AGE OVER 75
0.0/ 100
METRIC RATING
288th/ 347
METRIC RANK
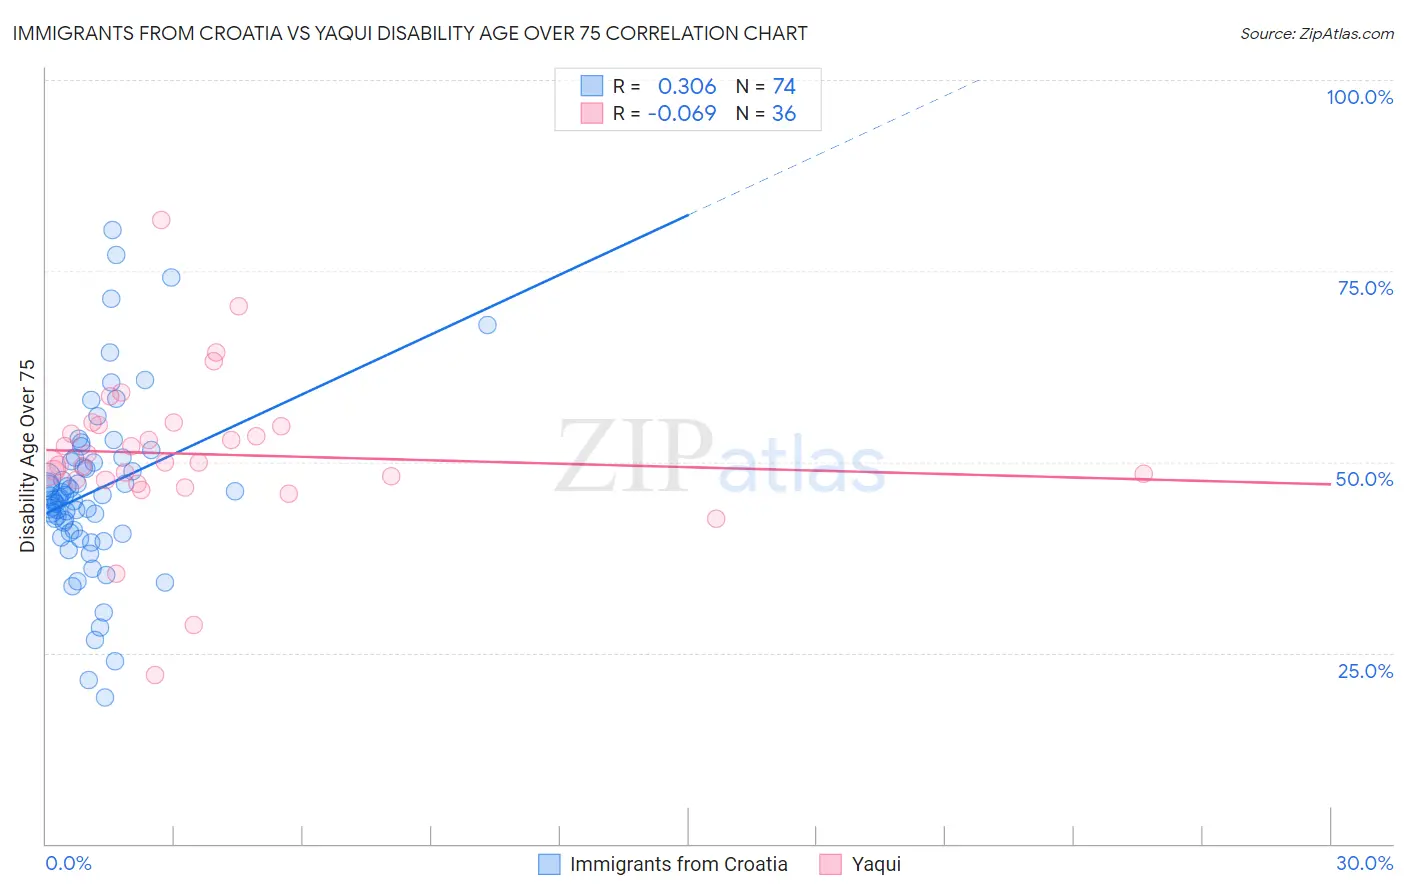
Immigrants from Croatia vs Yaqui Disability Age Over 75 Correlation Chart
The statistical analysis conducted on geographies consisting of 132,556,721 people shows a mild positive correlation between the proportion of Immigrants from Croatia and percentage of population with a disability over the age of 75 in the United States with a correlation coefficient (R) of 0.306 and weighted average of 45.5%. Similarly, the statistical analysis conducted on geographies consisting of 107,650,566 people shows a slight negative correlation between the proportion of Yaqui and percentage of population with a disability over the age of 75 in the United States with a correlation coefficient (R) of -0.069 and weighted average of 49.8%, a difference of 9.4%.
Disability Age Over 75 Correlation Summary
| Measurement | Immigrants from Croatia | Yaqui |
| Minimum | 19.1% | 22.1% |
| Maximum | 80.4% | 81.7% |
| Range | 61.3% | 59.5% |
| Mean | 46.2% | 51.0% |
| Median | 45.3% | 50.0% |
| Interquartile 25% (IQ1) | 40.8% | 47.6% |
| Interquartile 75% (IQ3) | 50.0% | 54.8% |
| Interquartile Range (IQR) | 9.3% | 7.1% |
| Standard Deviation (Sample) | 11.4% | 10.2% |
| Standard Deviation (Population) | 11.3% | 10.1% |
Similar Demographics by Disability Age Over 75
Demographics Similar to Immigrants from Croatia by Disability Age Over 75
In terms of disability age over 75, the demographic groups most similar to Immigrants from Croatia are Russian (45.5%, a difference of 0.030%), Norwegian (45.5%, a difference of 0.040%), Immigrants from Australia (45.5%, a difference of 0.060%), Immigrants from Taiwan (45.5%, a difference of 0.070%), and South African (45.5%, a difference of 0.070%).
| Demographics | Rating | Rank | Disability Age Over 75 |
| Macedonians | 99.9 /100 | #26 | Exceptional 45.4% |
| Immigrants | Poland | 99.9 /100 | #27 | Exceptional 45.4% |
| Thais | 99.9 /100 | #28 | Exceptional 45.4% |
| Filipinos | 99.9 /100 | #29 | Exceptional 45.4% |
| Immigrants | Denmark | 99.9 /100 | #30 | Exceptional 45.4% |
| Immigrants | Bulgaria | 99.9 /100 | #31 | Exceptional 45.5% |
| Immigrants | Australia | 99.9 /100 | #32 | Exceptional 45.5% |
| Immigrants | Croatia | 99.9 /100 | #33 | Exceptional 45.5% |
| Russians | 99.9 /100 | #34 | Exceptional 45.5% |
| Norwegians | 99.9 /100 | #35 | Exceptional 45.5% |
| Immigrants | Taiwan | 99.9 /100 | #36 | Exceptional 45.5% |
| South Africans | 99.9 /100 | #37 | Exceptional 45.5% |
| Italians | 99.9 /100 | #38 | Exceptional 45.6% |
| Estonians | 99.9 /100 | #39 | Exceptional 45.6% |
| Slovenes | 99.9 /100 | #40 | Exceptional 45.6% |
Demographics Similar to Yaqui by Disability Age Over 75
In terms of disability age over 75, the demographic groups most similar to Yaqui are Sioux (49.7%, a difference of 0.050%), Osage (49.8%, a difference of 0.080%), Puget Sound Salish (49.8%, a difference of 0.090%), Arapaho (49.8%, a difference of 0.090%), and Shoshone (49.9%, a difference of 0.16%).
| Demographics | Rating | Rank | Disability Age Over 75 |
| Belizeans | 0.0 /100 | #281 | Tragic 49.4% |
| Blacks/African Americans | 0.0 /100 | #282 | Tragic 49.5% |
| Samoans | 0.0 /100 | #283 | Tragic 49.5% |
| Immigrants | Latin America | 0.0 /100 | #284 | Tragic 49.5% |
| Crow | 0.0 /100 | #285 | Tragic 49.6% |
| Immigrants | Belize | 0.0 /100 | #286 | Tragic 49.6% |
| Sioux | 0.0 /100 | #287 | Tragic 49.7% |
| Yaqui | 0.0 /100 | #288 | Tragic 49.8% |
| Osage | 0.0 /100 | #289 | Tragic 49.8% |
| Puget Sound Salish | 0.0 /100 | #290 | Tragic 49.8% |
| Arapaho | 0.0 /100 | #291 | Tragic 49.8% |
| Shoshone | 0.0 /100 | #292 | Tragic 49.9% |
| Spanish American Indians | 0.0 /100 | #293 | Tragic 49.9% |
| Immigrants | Cambodia | 0.0 /100 | #294 | Tragic 50.0% |
| Spanish Americans | 0.0 /100 | #295 | Tragic 50.0% |