Immigrants from St. Vincent and the Grenadines vs Yaqui Disability Age Over 75
COMPARE
Immigrants from St. Vincent and the Grenadines
Yaqui
Disability Age Over 75
Disability Age Over 75 Comparison
Immigrants from St. Vincent and the Grenadines
Yaqui
48.2%
DISABILITY AGE OVER 75
3.2/ 100
METRIC RATING
237th/ 347
METRIC RANK
49.8%
DISABILITY AGE OVER 75
0.0/ 100
METRIC RATING
288th/ 347
METRIC RANK
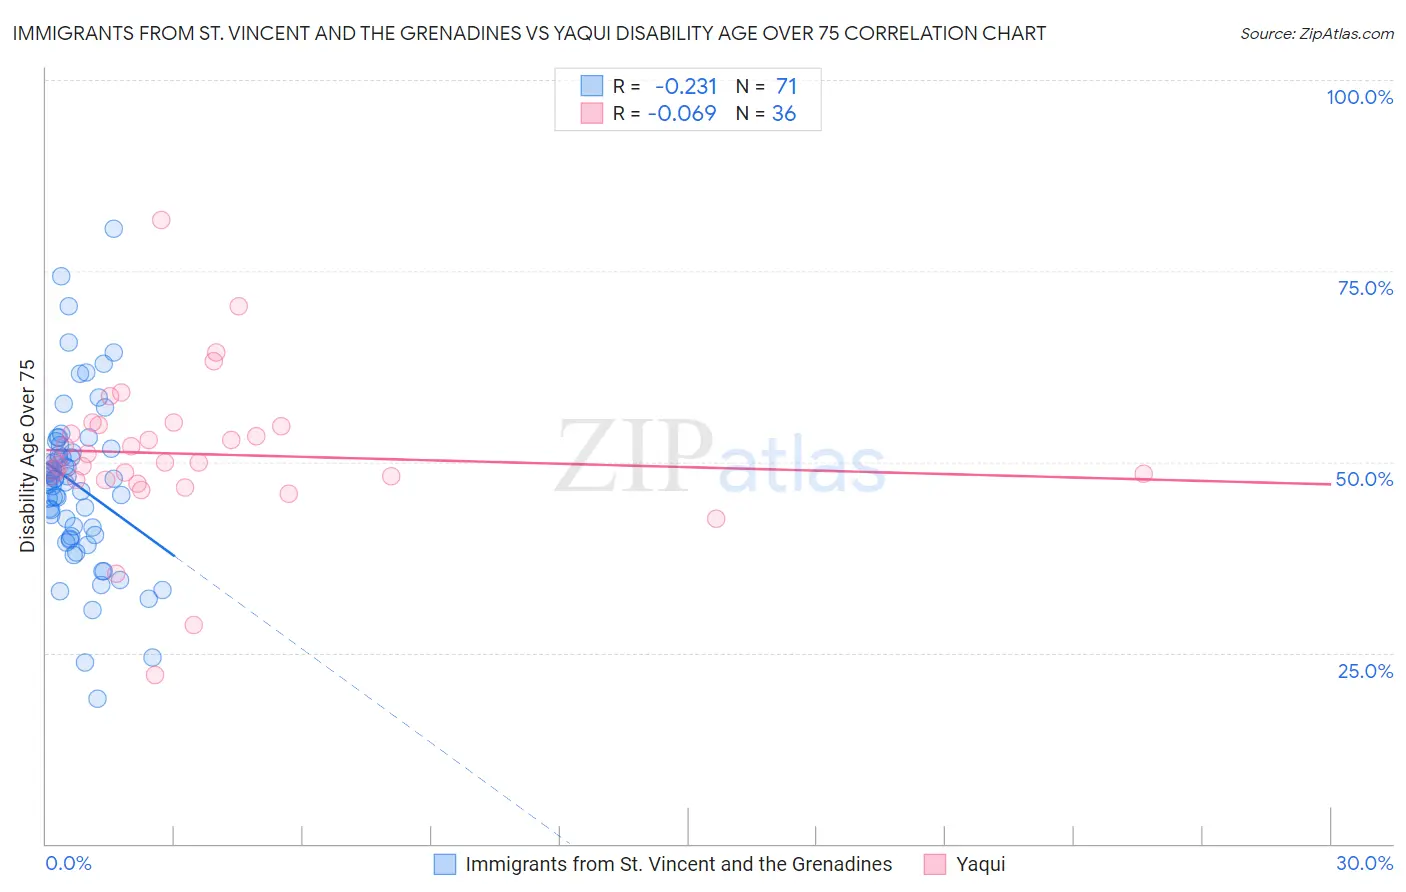
Immigrants from St. Vincent and the Grenadines vs Yaqui Disability Age Over 75 Correlation Chart
The statistical analysis conducted on geographies consisting of 56,132,853 people shows a weak negative correlation between the proportion of Immigrants from St. Vincent and the Grenadines and percentage of population with a disability over the age of 75 in the United States with a correlation coefficient (R) of -0.231 and weighted average of 48.2%. Similarly, the statistical analysis conducted on geographies consisting of 107,650,566 people shows a slight negative correlation between the proportion of Yaqui and percentage of population with a disability over the age of 75 in the United States with a correlation coefficient (R) of -0.069 and weighted average of 49.8%, a difference of 3.2%.
Disability Age Over 75 Correlation Summary
| Measurement | Immigrants from St. Vincent and the Grenadines | Yaqui |
| Minimum | 19.0% | 22.1% |
| Maximum | 80.4% | 81.7% |
| Range | 61.5% | 59.5% |
| Mean | 47.0% | 51.0% |
| Median | 47.5% | 50.0% |
| Interquartile 25% (IQ1) | 40.3% | 47.6% |
| Interquartile 75% (IQ3) | 51.8% | 54.8% |
| Interquartile Range (IQR) | 11.4% | 7.1% |
| Standard Deviation (Sample) | 10.9% | 10.2% |
| Standard Deviation (Population) | 10.8% | 10.1% |
Similar Demographics by Disability Age Over 75
Demographics Similar to Immigrants from St. Vincent and the Grenadines by Disability Age Over 75
In terms of disability age over 75, the demographic groups most similar to Immigrants from St. Vincent and the Grenadines are Immigrants from Nicaragua (48.2%, a difference of 0.0%), Nicaraguan (48.3%, a difference of 0.030%), Immigrants from Thailand (48.3%, a difference of 0.080%), Subsaharan African (48.2%, a difference of 0.10%), and Hmong (48.2%, a difference of 0.10%).
| Demographics | Rating | Rank | Disability Age Over 75 |
| Taiwanese | 4.4 /100 | #230 | Tragic 48.2% |
| Immigrants | Immigrants | 4.3 /100 | #231 | Tragic 48.2% |
| Indonesians | 4.2 /100 | #232 | Tragic 48.2% |
| Cree | 4.2 /100 | #233 | Tragic 48.2% |
| Sub-Saharan Africans | 3.8 /100 | #234 | Tragic 48.2% |
| Hmong | 3.8 /100 | #235 | Tragic 48.2% |
| Immigrants | Nicaragua | 3.2 /100 | #236 | Tragic 48.2% |
| Immigrants | St. Vincent and the Grenadines | 3.2 /100 | #237 | Tragic 48.2% |
| Nicaraguans | 3.0 /100 | #238 | Tragic 48.3% |
| Immigrants | Thailand | 2.8 /100 | #239 | Tragic 48.3% |
| Tongans | 2.3 /100 | #240 | Tragic 48.3% |
| Native Hawaiians | 2.2 /100 | #241 | Tragic 48.3% |
| French American Indians | 2.2 /100 | #242 | Tragic 48.3% |
| Immigrants | Caribbean | 2.1 /100 | #243 | Tragic 48.4% |
| Afghans | 1.8 /100 | #244 | Tragic 48.4% |
Demographics Similar to Yaqui by Disability Age Over 75
In terms of disability age over 75, the demographic groups most similar to Yaqui are Sioux (49.7%, a difference of 0.050%), Osage (49.8%, a difference of 0.080%), Puget Sound Salish (49.8%, a difference of 0.090%), Arapaho (49.8%, a difference of 0.090%), and Shoshone (49.9%, a difference of 0.16%).
| Demographics | Rating | Rank | Disability Age Over 75 |
| Belizeans | 0.0 /100 | #281 | Tragic 49.4% |
| Blacks/African Americans | 0.0 /100 | #282 | Tragic 49.5% |
| Samoans | 0.0 /100 | #283 | Tragic 49.5% |
| Immigrants | Latin America | 0.0 /100 | #284 | Tragic 49.5% |
| Crow | 0.0 /100 | #285 | Tragic 49.6% |
| Immigrants | Belize | 0.0 /100 | #286 | Tragic 49.6% |
| Sioux | 0.0 /100 | #287 | Tragic 49.7% |
| Yaqui | 0.0 /100 | #288 | Tragic 49.8% |
| Osage | 0.0 /100 | #289 | Tragic 49.8% |
| Puget Sound Salish | 0.0 /100 | #290 | Tragic 49.8% |
| Arapaho | 0.0 /100 | #291 | Tragic 49.8% |
| Shoshone | 0.0 /100 | #292 | Tragic 49.9% |
| Spanish American Indians | 0.0 /100 | #293 | Tragic 49.9% |
| Immigrants | Cambodia | 0.0 /100 | #294 | Tragic 50.0% |
| Spanish Americans | 0.0 /100 | #295 | Tragic 50.0% |