Immigrants from Laos vs Immigrants from Grenada Disability Age Over 75
COMPARE
Immigrants from Laos
Immigrants from Grenada
Disability Age Over 75
Disability Age Over 75 Comparison
Immigrants from Laos
Immigrants from Grenada
49.2%
DISABILITY AGE OVER 75
0.1/ 100
METRIC RATING
278th/ 347
METRIC RANK
47.9%
DISABILITY AGE OVER 75
9.4/ 100
METRIC RATING
217th/ 347
METRIC RANK
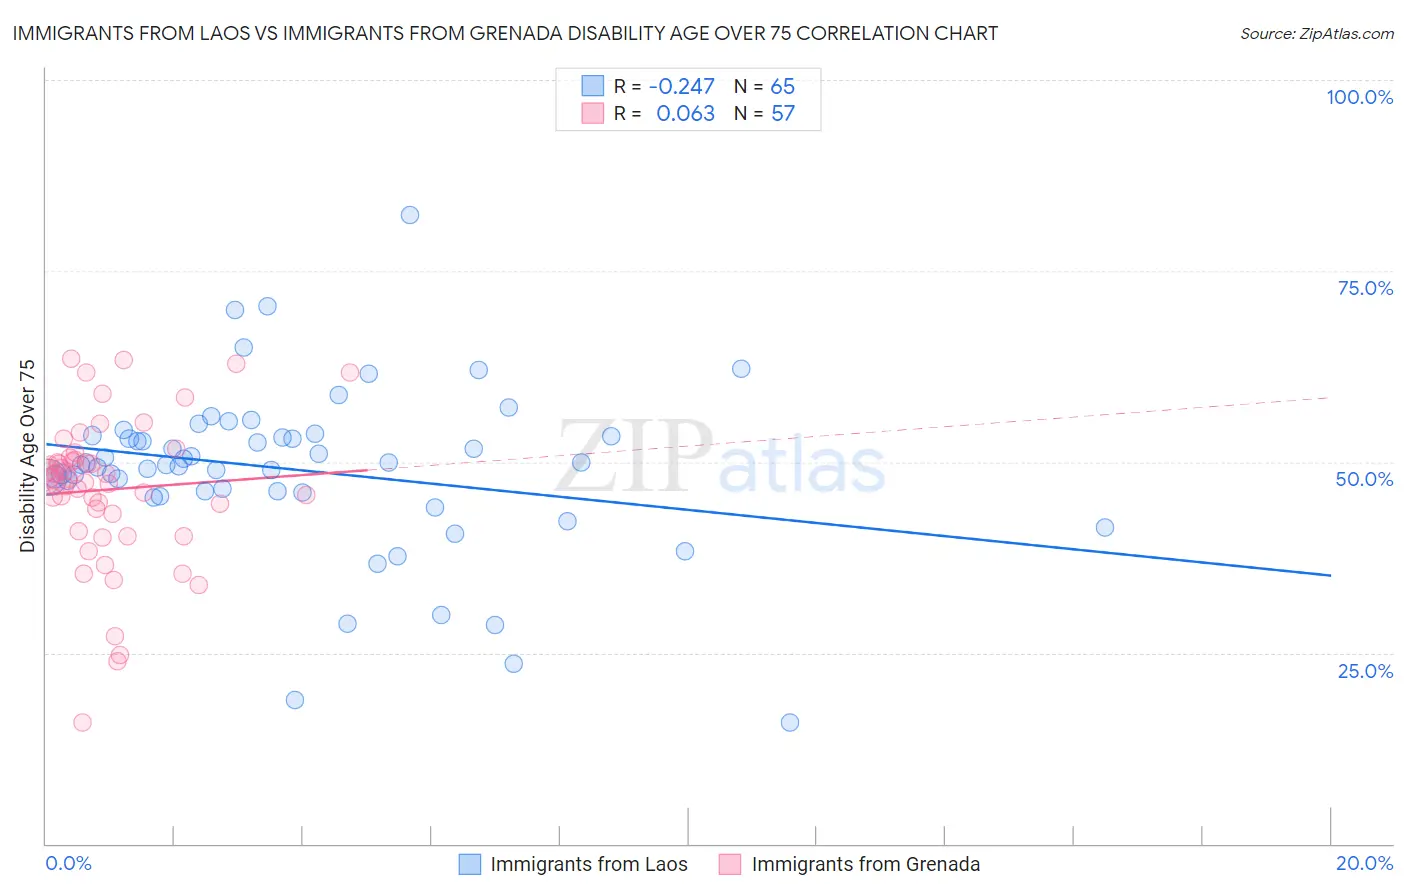
Immigrants from Laos vs Immigrants from Grenada Disability Age Over 75 Correlation Chart
The statistical analysis conducted on geographies consisting of 201,421,107 people shows a weak negative correlation between the proportion of Immigrants from Laos and percentage of population with a disability over the age of 75 in the United States with a correlation coefficient (R) of -0.247 and weighted average of 49.2%. Similarly, the statistical analysis conducted on geographies consisting of 67,162,084 people shows a slight positive correlation between the proportion of Immigrants from Grenada and percentage of population with a disability over the age of 75 in the United States with a correlation coefficient (R) of 0.063 and weighted average of 47.9%, a difference of 2.6%.
Disability Age Over 75 Correlation Summary
| Measurement | Immigrants from Laos | Immigrants from Grenada |
| Minimum | 15.9% | 15.8% |
| Maximum | 82.4% | 63.4% |
| Range | 66.5% | 47.6% |
| Mean | 49.0% | 46.4% |
| Median | 49.7% | 47.7% |
| Interquartile 25% (IQ1) | 46.1% | 42.1% |
| Interquartile 75% (IQ3) | 53.4% | 50.4% |
| Interquartile Range (IQR) | 7.3% | 8.3% |
| Standard Deviation (Sample) | 11.0% | 9.6% |
| Standard Deviation (Population) | 10.9% | 9.6% |
Similar Demographics by Disability Age Over 75
Demographics Similar to Immigrants from Laos by Disability Age Over 75
In terms of disability age over 75, the demographic groups most similar to Immigrants from Laos are Hawaiian (49.2%, a difference of 0.030%), Immigrants from Uzbekistan (49.2%, a difference of 0.060%), Immigrants from Dominica (49.1%, a difference of 0.17%), Immigrants from Guatemala (49.1%, a difference of 0.18%), and Immigrants from Iraq (49.1%, a difference of 0.26%).
| Demographics | Rating | Rank | Disability Age Over 75 |
| Fijians | 0.2 /100 | #271 | Tragic 49.0% |
| Assyrians/Chaldeans/Syriacs | 0.2 /100 | #272 | Tragic 49.1% |
| Immigrants | Iraq | 0.1 /100 | #273 | Tragic 49.1% |
| Immigrants | Guatemala | 0.1 /100 | #274 | Tragic 49.1% |
| Immigrants | Dominica | 0.1 /100 | #275 | Tragic 49.1% |
| Immigrants | Uzbekistan | 0.1 /100 | #276 | Tragic 49.2% |
| Hawaiians | 0.1 /100 | #277 | Tragic 49.2% |
| Immigrants | Laos | 0.1 /100 | #278 | Tragic 49.2% |
| Guamanians/Chamorros | 0.0 /100 | #279 | Tragic 49.4% |
| Bangladeshis | 0.0 /100 | #280 | Tragic 49.4% |
| Belizeans | 0.0 /100 | #281 | Tragic 49.4% |
| Blacks/African Americans | 0.0 /100 | #282 | Tragic 49.5% |
| Samoans | 0.0 /100 | #283 | Tragic 49.5% |
| Immigrants | Latin America | 0.0 /100 | #284 | Tragic 49.5% |
| Crow | 0.0 /100 | #285 | Tragic 49.6% |
Demographics Similar to Immigrants from Grenada by Disability Age Over 75
In terms of disability age over 75, the demographic groups most similar to Immigrants from Grenada are Immigrants from Panama (47.9%, a difference of 0.050%), Immigrants from Western Africa (48.0%, a difference of 0.070%), Immigrants from Barbados (47.9%, a difference of 0.080%), Senegalese (47.9%, a difference of 0.080%), and Laotian (47.9%, a difference of 0.12%).
| Demographics | Rating | Rank | Disability Age Over 75 |
| Vietnamese | 11.9 /100 | #210 | Poor 47.9% |
| Panamanians | 11.8 /100 | #211 | Poor 47.9% |
| Immigrants | Burma/Myanmar | 11.7 /100 | #212 | Poor 47.9% |
| Laotians | 11.5 /100 | #213 | Poor 47.9% |
| Immigrants | Barbados | 10.7 /100 | #214 | Poor 47.9% |
| Senegalese | 10.7 /100 | #215 | Poor 47.9% |
| Immigrants | Panama | 10.2 /100 | #216 | Poor 47.9% |
| Immigrants | Grenada | 9.4 /100 | #217 | Tragic 47.9% |
| Immigrants | Western Africa | 8.3 /100 | #218 | Tragic 48.0% |
| Immigrants | Western Asia | 7.5 /100 | #219 | Tragic 48.0% |
| Bahamians | 7.4 /100 | #220 | Tragic 48.0% |
| Immigrants | Oceania | 7.3 /100 | #221 | Tragic 48.0% |
| Barbadians | 6.8 /100 | #222 | Tragic 48.0% |
| Immigrants | Bangladesh | 6.8 /100 | #223 | Tragic 48.0% |
| Liberians | 6.7 /100 | #224 | Tragic 48.0% |