Immigrants from Laos vs Moroccan Self-Care Disability
COMPARE
Immigrants from Laos
Moroccan
Self-Care Disability
Self-Care Disability Comparison
Immigrants from Laos
Moroccans
2.7%
SELF-CARE DISABILITY
0.1/ 100
METRIC RATING
272nd/ 347
METRIC RANK
2.5%
SELF-CARE DISABILITY
22.9/ 100
METRIC RATING
191st/ 347
METRIC RANK
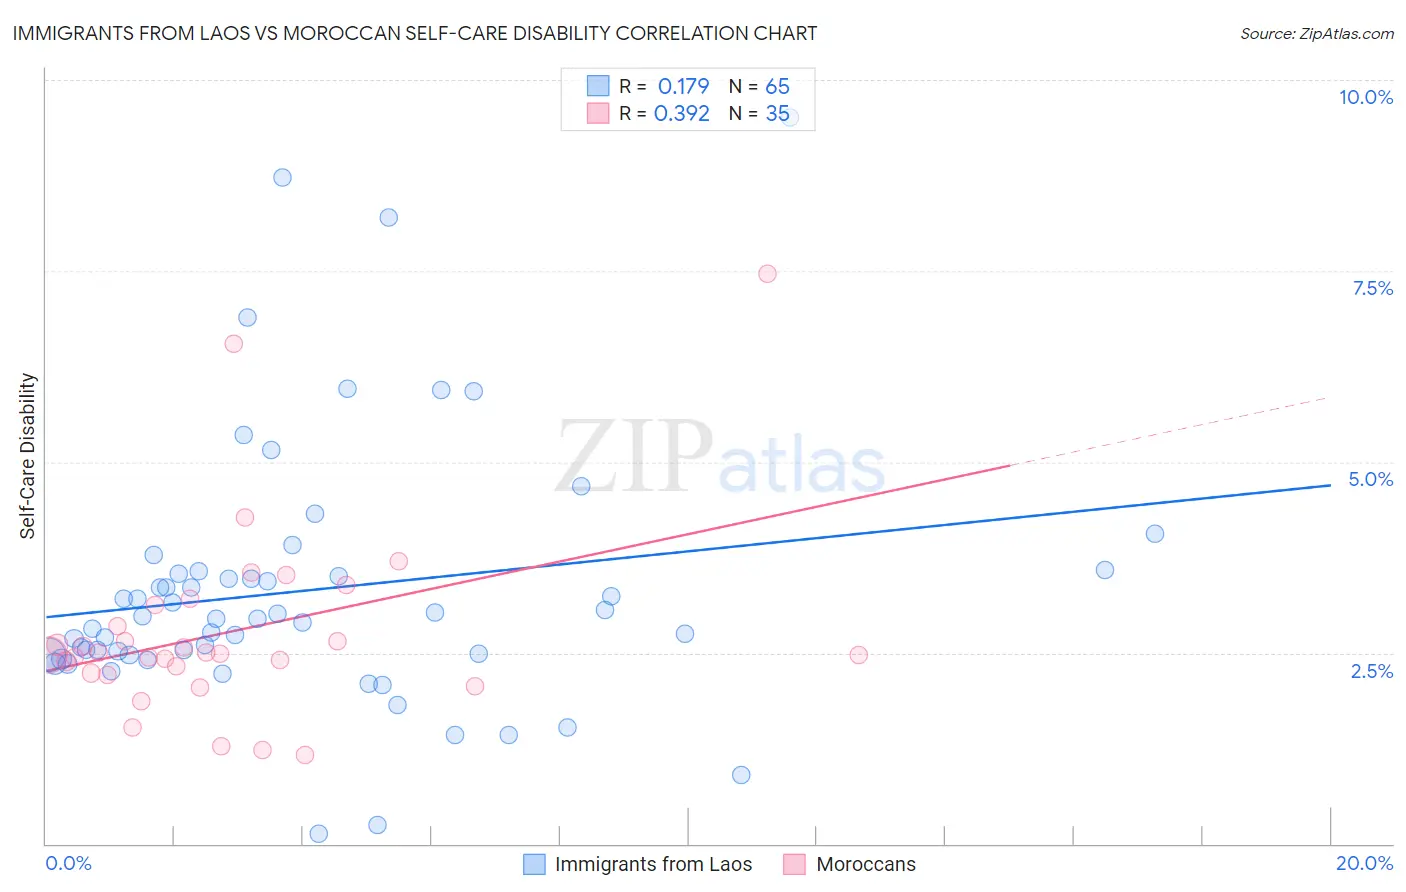
Immigrants from Laos vs Moroccan Self-Care Disability Correlation Chart
The statistical analysis conducted on geographies consisting of 201,433,768 people shows a poor positive correlation between the proportion of Immigrants from Laos and percentage of population with self-care disability in the United States with a correlation coefficient (R) of 0.179 and weighted average of 2.7%. Similarly, the statistical analysis conducted on geographies consisting of 201,730,975 people shows a mild positive correlation between the proportion of Moroccans and percentage of population with self-care disability in the United States with a correlation coefficient (R) of 0.392 and weighted average of 2.5%, a difference of 6.8%.
Self-Care Disability Correlation Summary
| Measurement | Immigrants from Laos | Moroccan |
| Minimum | 0.13% | 1.2% |
| Maximum | 9.5% | 7.5% |
| Range | 9.4% | 6.3% |
| Mean | 3.3% | 2.8% |
| Median | 3.0% | 2.5% |
| Interquartile 25% (IQ1) | 2.5% | 2.2% |
| Interquartile 75% (IQ3) | 3.6% | 3.1% |
| Interquartile Range (IQR) | 1.1% | 0.89% |
| Standard Deviation (Sample) | 1.7% | 1.3% |
| Standard Deviation (Population) | 1.7% | 1.2% |
Similar Demographics by Self-Care Disability
Demographics Similar to Immigrants from Laos by Self-Care Disability
In terms of self-care disability, the demographic groups most similar to Immigrants from Laos are Trinidadian and Tobagonian (2.7%, a difference of 0.040%), Immigrants from Micronesia (2.7%, a difference of 0.10%), Mexican (2.7%, a difference of 0.13%), U.S. Virgin Islander (2.7%, a difference of 0.14%), and Yakama (2.7%, a difference of 0.20%).
| Demographics | Rating | Rank | Self-Care Disability |
| Immigrants | Nicaragua | 0.2 /100 | #265 | Tragic 2.7% |
| Immigrants | Cambodia | 0.1 /100 | #266 | Tragic 2.7% |
| Yaqui | 0.1 /100 | #267 | Tragic 2.7% |
| Immigrants | Mexico | 0.1 /100 | #268 | Tragic 2.7% |
| U.S. Virgin Islanders | 0.1 /100 | #269 | Tragic 2.7% |
| Immigrants | Micronesia | 0.1 /100 | #270 | Tragic 2.7% |
| Trinidadians and Tobagonians | 0.1 /100 | #271 | Tragic 2.7% |
| Immigrants | Laos | 0.1 /100 | #272 | Tragic 2.7% |
| Mexicans | 0.1 /100 | #273 | Tragic 2.7% |
| Yakama | 0.1 /100 | #274 | Tragic 2.7% |
| Immigrants | Trinidad and Tobago | 0.1 /100 | #275 | Tragic 2.7% |
| Japanese | 0.1 /100 | #276 | Tragic 2.7% |
| Immigrants | Ukraine | 0.1 /100 | #277 | Tragic 2.7% |
| Ottawa | 0.1 /100 | #278 | Tragic 2.7% |
| Iroquois | 0.1 /100 | #279 | Tragic 2.7% |
Demographics Similar to Moroccans by Self-Care Disability
In terms of self-care disability, the demographic groups most similar to Moroccans are Soviet Union (2.5%, a difference of 0.050%), Sioux (2.5%, a difference of 0.11%), Ukrainian (2.5%, a difference of 0.11%), Immigrants from Eastern Europe (2.5%, a difference of 0.32%), and Immigrants from Oceania (2.5%, a difference of 0.33%).
| Demographics | Rating | Rank | Self-Care Disability |
| Yugoslavians | 36.1 /100 | #184 | Fair 2.5% |
| Slavs | 34.3 /100 | #185 | Fair 2.5% |
| Immigrants | El Salvador | 33.0 /100 | #186 | Fair 2.5% |
| Irish | 28.7 /100 | #187 | Fair 2.5% |
| Immigrants | Oceania | 28.3 /100 | #188 | Fair 2.5% |
| Immigrants | Eastern Europe | 28.0 /100 | #189 | Fair 2.5% |
| Sioux | 24.6 /100 | #190 | Fair 2.5% |
| Moroccans | 22.9 /100 | #191 | Fair 2.5% |
| Soviet Union | 22.2 /100 | #192 | Fair 2.5% |
| Ukrainians | 21.4 /100 | #193 | Fair 2.5% |
| Immigrants | Germany | 17.9 /100 | #194 | Poor 2.5% |
| Immigrants | Southern Europe | 15.6 /100 | #195 | Poor 2.5% |
| Koreans | 15.5 /100 | #196 | Poor 2.5% |
| Crow | 15.2 /100 | #197 | Poor 2.5% |
| Immigrants | Immigrants | 15.0 /100 | #198 | Poor 2.5% |