Immigrants from Laos vs Moroccan Male Disability
COMPARE
Immigrants from Laos
Moroccan
Male Disability
Male Disability Comparison
Immigrants from Laos
Moroccans
11.9%
MALE DISABILITY
1.0/ 100
METRIC RATING
244th/ 347
METRIC RANK
11.0%
MALE DISABILITY
80.7/ 100
METRIC RATING
143rd/ 347
METRIC RANK
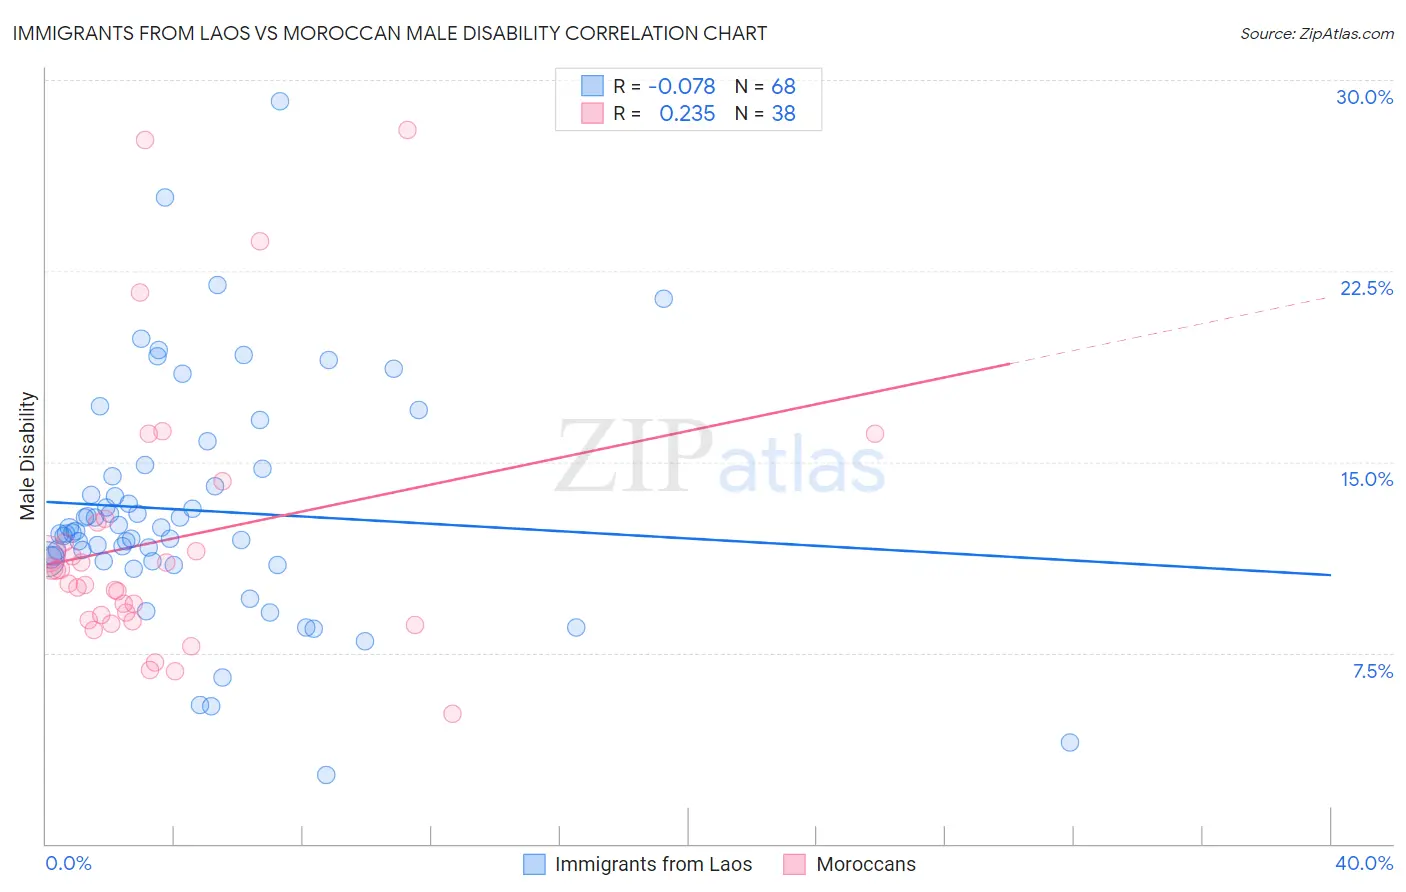
Immigrants from Laos vs Moroccan Male Disability Correlation Chart
The statistical analysis conducted on geographies consisting of 201,462,154 people shows a slight negative correlation between the proportion of Immigrants from Laos and percentage of males with a disability in the United States with a correlation coefficient (R) of -0.078 and weighted average of 11.9%. Similarly, the statistical analysis conducted on geographies consisting of 201,806,730 people shows a weak positive correlation between the proportion of Moroccans and percentage of males with a disability in the United States with a correlation coefficient (R) of 0.235 and weighted average of 11.0%, a difference of 8.5%.
Male Disability Correlation Summary
| Measurement | Immigrants from Laos | Moroccan |
| Minimum | 2.7% | 5.1% |
| Maximum | 29.2% | 28.0% |
| Range | 26.5% | 22.9% |
| Mean | 13.1% | 11.9% |
| Median | 12.2% | 10.5% |
| Interquartile 25% (IQ1) | 11.1% | 8.8% |
| Interquartile 75% (IQ3) | 14.6% | 12.6% |
| Interquartile Range (IQR) | 3.5% | 3.8% |
| Standard Deviation (Sample) | 4.6% | 5.3% |
| Standard Deviation (Population) | 4.6% | 5.2% |
Similar Demographics by Male Disability
Demographics Similar to Immigrants from Laos by Male Disability
In terms of male disability, the demographic groups most similar to Immigrants from Laos are Immigrants from Liberia (11.9%, a difference of 0.0%), Danish (11.9%, a difference of 0.040%), Samoan (11.9%, a difference of 0.11%), Northern European (11.9%, a difference of 0.14%), and Bahamian (11.9%, a difference of 0.16%).
| Demographics | Rating | Rank | Male Disability |
| Carpatho Rusyns | 1.3 /100 | #237 | Tragic 11.9% |
| Yugoslavians | 1.2 /100 | #238 | Tragic 11.9% |
| Italians | 1.2 /100 | #239 | Tragic 11.9% |
| Czechs | 1.1 /100 | #240 | Tragic 11.9% |
| Bahamians | 1.1 /100 | #241 | Tragic 11.9% |
| Northern Europeans | 1.1 /100 | #242 | Tragic 11.9% |
| Samoans | 1.1 /100 | #243 | Tragic 11.9% |
| Immigrants | Laos | 1.0 /100 | #244 | Tragic 11.9% |
| Immigrants | Liberia | 1.0 /100 | #245 | Tragic 11.9% |
| Danes | 0.9 /100 | #246 | Tragic 11.9% |
| Hungarians | 0.8 /100 | #247 | Tragic 12.0% |
| Poles | 0.7 /100 | #248 | Tragic 12.0% |
| Immigrants | Yemen | 0.5 /100 | #249 | Tragic 12.0% |
| Bangladeshis | 0.5 /100 | #250 | Tragic 12.0% |
| German Russians | 0.5 /100 | #251 | Tragic 12.0% |
Demographics Similar to Moroccans by Male Disability
In terms of male disability, the demographic groups most similar to Moroccans are Immigrants from Italy (11.0%, a difference of 0.070%), Arab (11.0%, a difference of 0.070%), Immigrants from Sudan (11.0%, a difference of 0.070%), South African (11.0%, a difference of 0.090%), and Nigerian (11.0%, a difference of 0.11%).
| Demographics | Rating | Rank | Male Disability |
| Immigrants | Costa Rica | 82.8 /100 | #136 | Excellent 11.0% |
| Immigrants | Europe | 82.0 /100 | #137 | Excellent 11.0% |
| Nigerians | 81.9 /100 | #138 | Excellent 11.0% |
| South Africans | 81.7 /100 | #139 | Excellent 11.0% |
| Immigrants | Italy | 81.5 /100 | #140 | Excellent 11.0% |
| Arabs | 81.5 /100 | #141 | Excellent 11.0% |
| Immigrants | Sudan | 81.5 /100 | #142 | Excellent 11.0% |
| Moroccans | 80.7 /100 | #143 | Excellent 11.0% |
| Kenyans | 78.1 /100 | #144 | Good 11.0% |
| Costa Ricans | 78.0 /100 | #145 | Good 11.0% |
| Koreans | 77.5 /100 | #146 | Good 11.0% |
| Immigrants | Croatia | 77.3 /100 | #147 | Good 11.0% |
| Sudanese | 77.1 /100 | #148 | Good 11.0% |
| Immigrants | Denmark | 76.4 /100 | #149 | Good 11.0% |
| Immigrants | Guatemala | 75.1 /100 | #150 | Good 11.0% |