Immigrants from Kenya vs Albanian Self-Care Disability
COMPARE
Immigrants from Kenya
Albanian
Self-Care Disability
Self-Care Disability Comparison
Immigrants from Kenya
Albanians
2.3%
SELF-CARE DISABILITY
99.0/ 100
METRIC RATING
79th/ 347
METRIC RANK
2.6%
SELF-CARE DISABILITY
2.2/ 100
METRIC RATING
232nd/ 347
METRIC RANK
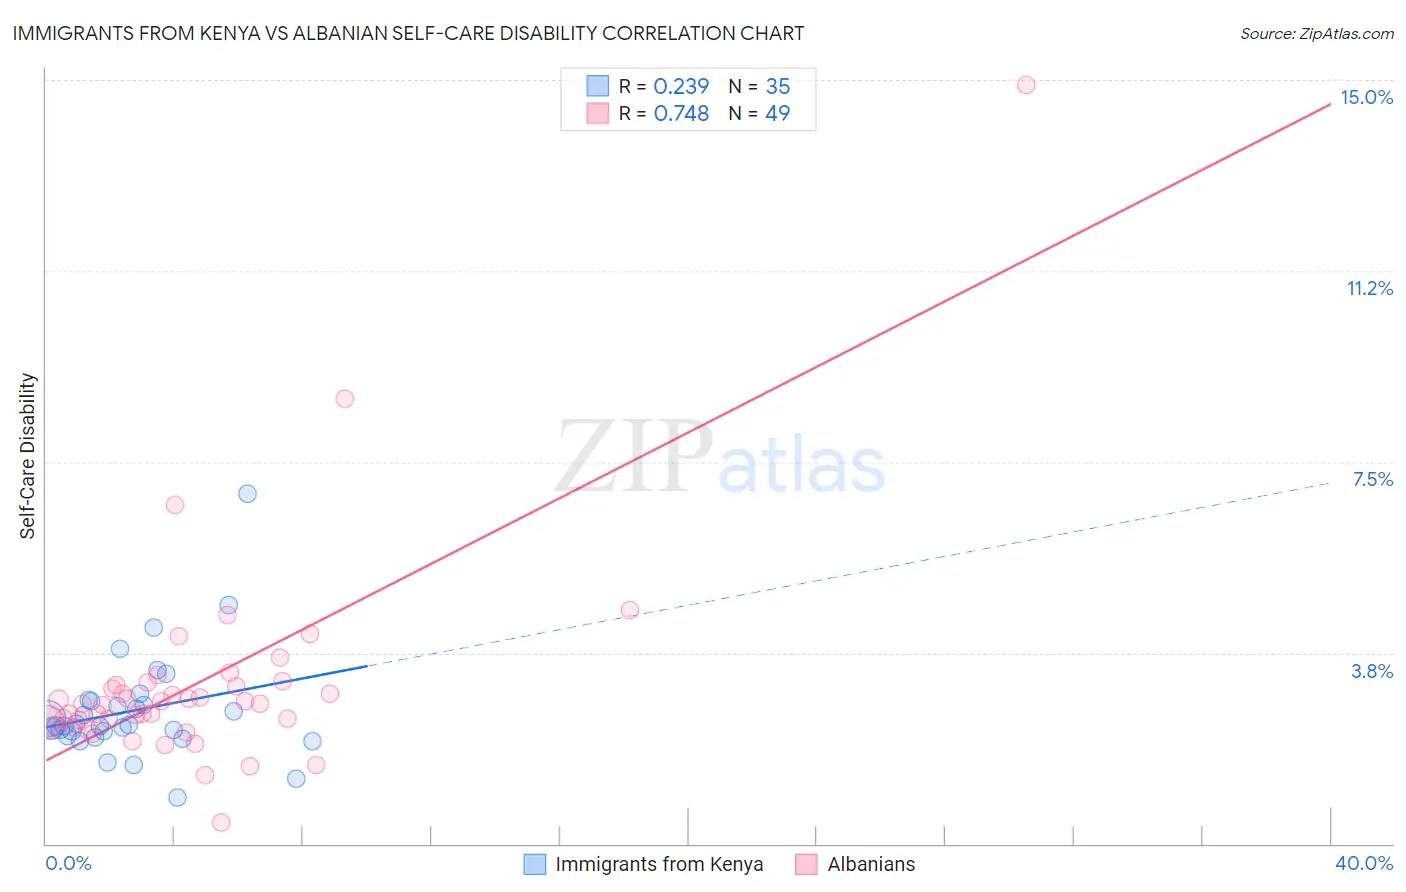
Immigrants from Kenya vs Albanian Self-Care Disability Correlation Chart
The statistical analysis conducted on geographies consisting of 217,918,601 people shows a weak positive correlation between the proportion of Immigrants from Kenya and percentage of population with self-care disability in the United States with a correlation coefficient (R) of 0.239 and weighted average of 2.3%. Similarly, the statistical analysis conducted on geographies consisting of 193,148,254 people shows a strong positive correlation between the proportion of Albanians and percentage of population with self-care disability in the United States with a correlation coefficient (R) of 0.748 and weighted average of 2.6%, a difference of 10.6%.
Self-Care Disability Correlation Summary
| Measurement | Immigrants from Kenya | Albanian |
| Minimum | 0.90% | 0.42% |
| Maximum | 6.9% | 14.9% |
| Range | 6.0% | 14.5% |
| Mean | 2.6% | 3.2% |
| Median | 2.3% | 2.7% |
| Interquartile 25% (IQ1) | 2.1% | 2.3% |
| Interquartile 75% (IQ3) | 2.8% | 3.1% |
| Interquartile Range (IQR) | 0.68% | 0.80% |
| Standard Deviation (Sample) | 1.1% | 2.1% |
| Standard Deviation (Population) | 1.0% | 2.1% |
Similar Demographics by Self-Care Disability
Demographics Similar to Immigrants from Kenya by Self-Care Disability
In terms of self-care disability, the demographic groups most similar to Immigrants from Kenya are Immigrants from Middle Africa (2.3%, a difference of 0.010%), Immigrants from Ireland (2.3%, a difference of 0.010%), Immigrants from China (2.3%, a difference of 0.090%), Immigrants from Netherlands (2.3%, a difference of 0.10%), and Immigrants from Switzerland (2.3%, a difference of 0.14%).
| Demographics | Rating | Rank | Self-Care Disability |
| Eastern Europeans | 99.2 /100 | #72 | Exceptional 2.3% |
| Immigrants | Egypt | 99.1 /100 | #73 | Exceptional 2.3% |
| Immigrants | Switzerland | 99.1 /100 | #74 | Exceptional 2.3% |
| Immigrants | Netherlands | 99.1 /100 | #75 | Exceptional 2.3% |
| Immigrants | China | 99.1 /100 | #76 | Exceptional 2.3% |
| Immigrants | Middle Africa | 99.0 /100 | #77 | Exceptional 2.3% |
| Immigrants | Ireland | 99.0 /100 | #78 | Exceptional 2.3% |
| Immigrants | Kenya | 99.0 /100 | #79 | Exceptional 2.3% |
| Chileans | 98.8 /100 | #80 | Exceptional 2.3% |
| Ugandans | 98.8 /100 | #81 | Exceptional 2.3% |
| Immigrants | Denmark | 98.8 /100 | #82 | Exceptional 2.3% |
| Indians (Asian) | 98.7 /100 | #83 | Exceptional 2.3% |
| Immigrants | Spain | 98.7 /100 | #84 | Exceptional 2.3% |
| Estonians | 98.3 /100 | #85 | Exceptional 2.3% |
| Immigrants | Northern Africa | 98.2 /100 | #86 | Exceptional 2.3% |
Demographics Similar to Albanians by Self-Care Disability
In terms of self-care disability, the demographic groups most similar to Albanians are Immigrants from Guatemala (2.6%, a difference of 0.030%), Liberian (2.6%, a difference of 0.040%), Vietnamese (2.6%, a difference of 0.050%), Bahamian (2.6%, a difference of 0.090%), and Bermudan (2.6%, a difference of 0.15%).
| Demographics | Rating | Rank | Self-Care Disability |
| Iraqis | 3.2 /100 | #225 | Tragic 2.6% |
| Chinese | 2.9 /100 | #226 | Tragic 2.6% |
| Immigrants | Philippines | 2.7 /100 | #227 | Tragic 2.6% |
| Guatemalans | 2.7 /100 | #228 | Tragic 2.6% |
| Guamanians/Chamorros | 2.5 /100 | #229 | Tragic 2.6% |
| Immigrants | Ecuador | 2.5 /100 | #230 | Tragic 2.6% |
| Immigrants | Guatemala | 2.2 /100 | #231 | Tragic 2.6% |
| Albanians | 2.2 /100 | #232 | Tragic 2.6% |
| Liberians | 2.1 /100 | #233 | Tragic 2.6% |
| Vietnamese | 2.1 /100 | #234 | Tragic 2.6% |
| Bahamians | 2.0 /100 | #235 | Tragic 2.6% |
| Bermudans | 1.9 /100 | #236 | Tragic 2.6% |
| Immigrants | Senegal | 1.6 /100 | #237 | Tragic 2.6% |
| Senegalese | 1.3 /100 | #238 | Tragic 2.6% |
| Immigrants | Panama | 1.2 /100 | #239 | Tragic 2.6% |