Immigrants from Jordan vs Spanish American Indian 7th Grade
COMPARE
Immigrants from Jordan
Spanish American Indian
7th Grade
7th Grade Comparison
Immigrants from Jordan
Spanish American Indians
96.2%
7TH GRADE
77.0/ 100
METRIC RATING
155th/ 347
METRIC RANK
90.3%
7TH GRADE
0.0/ 100
METRIC RATING
347th/ 347
METRIC RANK
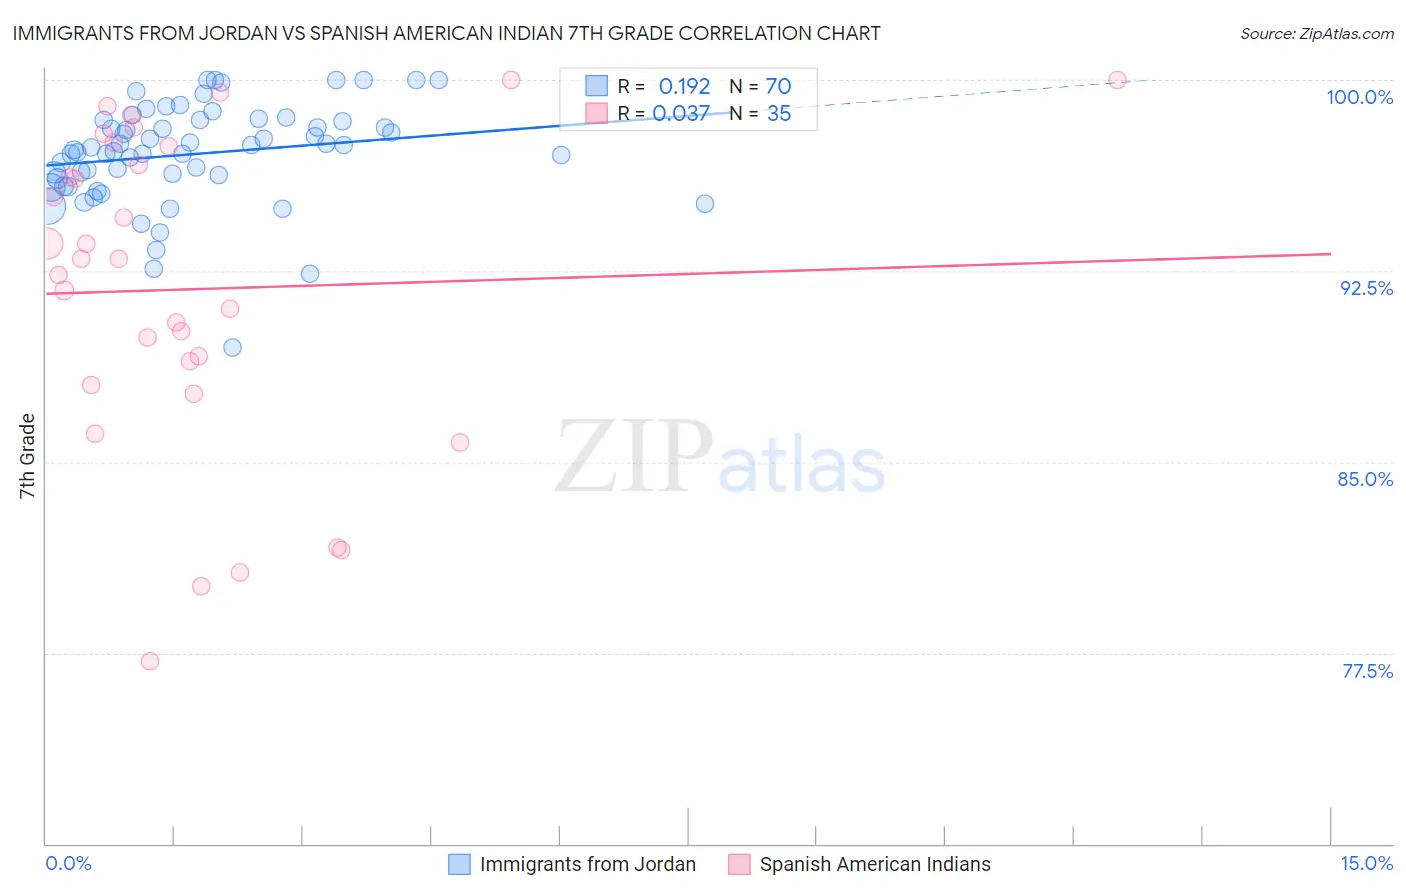
Immigrants from Jordan vs Spanish American Indian 7th Grade Correlation Chart
The statistical analysis conducted on geographies consisting of 181,269,353 people shows a poor positive correlation between the proportion of Immigrants from Jordan and percentage of population with at least 7th grade education in the United States with a correlation coefficient (R) of 0.192 and weighted average of 96.2%. Similarly, the statistical analysis conducted on geographies consisting of 73,150,359 people shows no correlation between the proportion of Spanish American Indians and percentage of population with at least 7th grade education in the United States with a correlation coefficient (R) of 0.037 and weighted average of 90.3%, a difference of 6.6%.
7th Grade Correlation Summary
| Measurement | Immigrants from Jordan | Spanish American Indian |
| Minimum | 89.5% | 77.1% |
| Maximum | 100.0% | 100.0% |
| Range | 10.5% | 22.9% |
| Mean | 97.1% | 91.8% |
| Median | 97.3% | 93.0% |
| Interquartile 25% (IQ1) | 96.1% | 88.0% |
| Interquartile 75% (IQ3) | 98.4% | 97.4% |
| Interquartile Range (IQR) | 2.3% | 9.4% |
| Standard Deviation (Sample) | 2.0% | 6.3% |
| Standard Deviation (Population) | 2.0% | 6.2% |
Similar Demographics by 7th Grade
Demographics Similar to Immigrants from Jordan by 7th Grade
In terms of 7th grade, the demographic groups most similar to Immigrants from Jordan are Immigrants from Israel (96.2%, a difference of 0.0%), Immigrants from Russia (96.2%, a difference of 0.010%), Seminole (96.2%, a difference of 0.010%), Kenyan (96.2%, a difference of 0.010%), and Ugandan (96.2%, a difference of 0.010%).
| Demographics | Rating | Rank | 7th Grade |
| Israelis | 82.8 /100 | #148 | Excellent 96.3% |
| Albanians | 82.6 /100 | #149 | Excellent 96.3% |
| Immigrants | Belarus | 82.4 /100 | #150 | Excellent 96.3% |
| Hopi | 81.6 /100 | #151 | Excellent 96.3% |
| Immigrants | Russia | 78.4 /100 | #152 | Good 96.2% |
| Seminole | 78.1 /100 | #153 | Good 96.2% |
| Immigrants | Israel | 77.6 /100 | #154 | Good 96.2% |
| Immigrants | Jordan | 77.0 /100 | #155 | Good 96.2% |
| Kenyans | 76.2 /100 | #156 | Good 96.2% |
| Ugandans | 75.5 /100 | #157 | Good 96.2% |
| Arabs | 68.6 /100 | #158 | Good 96.2% |
| Alsatians | 67.2 /100 | #159 | Good 96.1% |
| Immigrants | Kenya | 66.8 /100 | #160 | Good 96.1% |
| Bermudans | 66.3 /100 | #161 | Good 96.1% |
| Pima | 64.3 /100 | #162 | Good 96.1% |
Demographics Similar to Spanish American Indians by 7th Grade
In terms of 7th grade, the demographic groups most similar to Spanish American Indians are Immigrants from Mexico (90.7%, a difference of 0.48%), Immigrants from El Salvador (90.9%, a difference of 0.68%), Immigrants from Central America (91.0%, a difference of 0.75%), Immigrants from Guatemala (91.3%, a difference of 1.1%), and Salvadoran (91.5%, a difference of 1.3%).
| Demographics | Rating | Rank | 7th Grade |
| Immigrants | Armenia | 0.0 /100 | #333 | Tragic 92.7% |
| Immigrants | Yemen | 0.0 /100 | #334 | Tragic 92.6% |
| Mexican American Indians | 0.0 /100 | #335 | Tragic 92.6% |
| Immigrants | Honduras | 0.0 /100 | #336 | Tragic 92.5% |
| Immigrants | Latin America | 0.0 /100 | #337 | Tragic 92.2% |
| Central Americans | 0.0 /100 | #338 | Tragic 92.1% |
| Mexicans | 0.0 /100 | #339 | Tragic 91.9% |
| Yakama | 0.0 /100 | #340 | Tragic 91.7% |
| Guatemalans | 0.0 /100 | #341 | Tragic 91.7% |
| Salvadorans | 0.0 /100 | #342 | Tragic 91.5% |
| Immigrants | Guatemala | 0.0 /100 | #343 | Tragic 91.3% |
| Immigrants | Central America | 0.0 /100 | #344 | Tragic 91.0% |
| Immigrants | El Salvador | 0.0 /100 | #345 | Tragic 90.9% |
| Immigrants | Mexico | 0.0 /100 | #346 | Tragic 90.7% |
| Spanish American Indians | 0.0 /100 | #347 | Tragic 90.3% |