Colombian vs Polish Male Disability
COMPARE
Colombian
Polish
Male Disability
Male Disability Comparison
Colombians
Poles
10.5%
MALE DISABILITY
99.2/ 100
METRIC RATING
68th/ 347
METRIC RANK
12.0%
MALE DISABILITY
0.7/ 100
METRIC RATING
248th/ 347
METRIC RANK
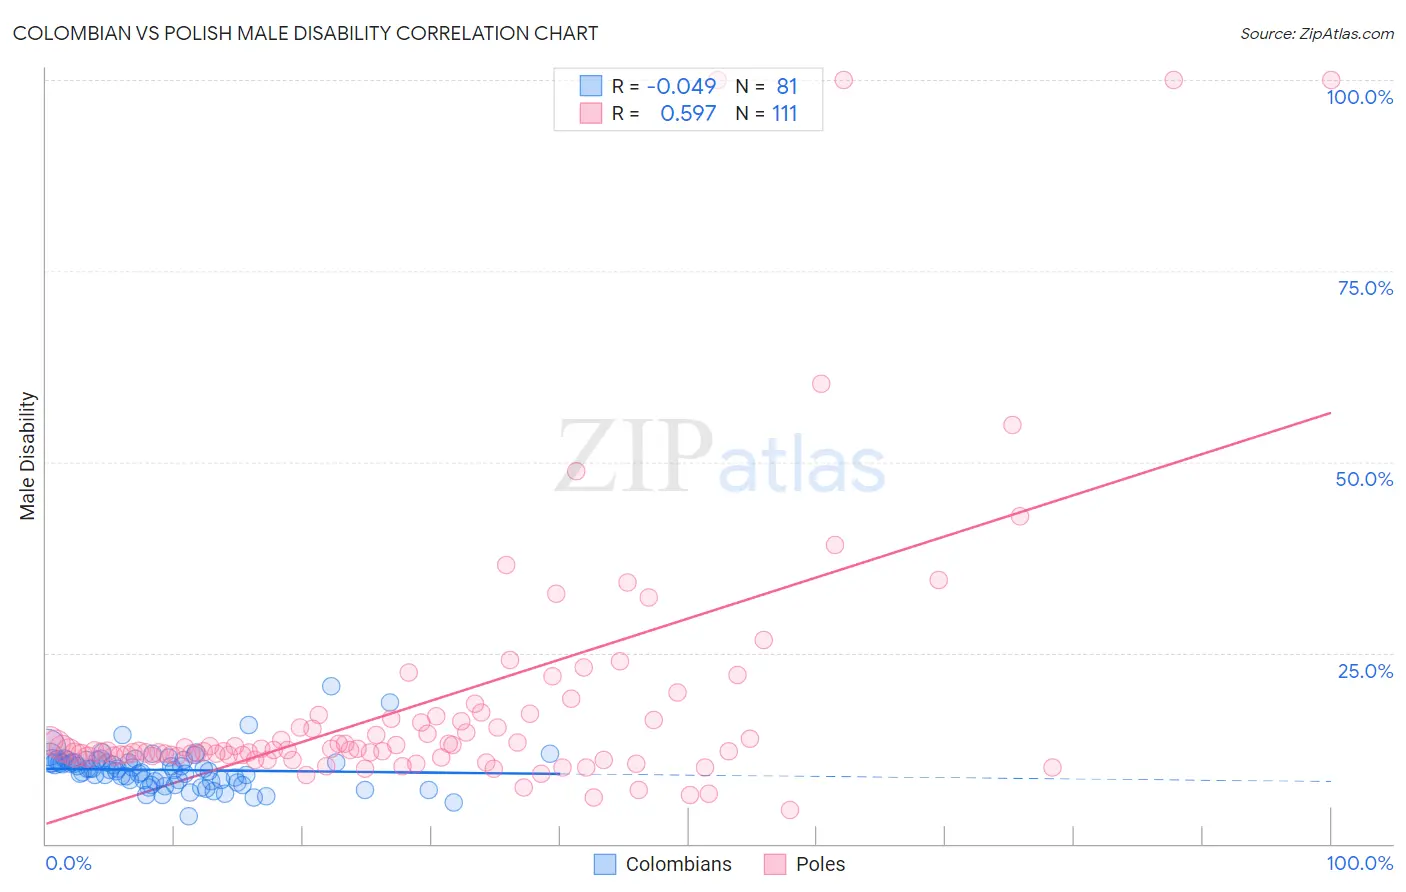
Colombian vs Polish Male Disability Correlation Chart
The statistical analysis conducted on geographies consisting of 419,578,648 people shows no correlation between the proportion of Colombians and percentage of males with a disability in the United States with a correlation coefficient (R) of -0.049 and weighted average of 10.5%. Similarly, the statistical analysis conducted on geographies consisting of 560,313,997 people shows a substantial positive correlation between the proportion of Poles and percentage of males with a disability in the United States with a correlation coefficient (R) of 0.597 and weighted average of 12.0%, a difference of 14.4%.
Male Disability Correlation Summary
| Measurement | Colombian | Polish |
| Minimum | 3.6% | 4.3% |
| Maximum | 20.7% | 100.0% |
| Range | 17.1% | 95.7% |
| Mean | 9.7% | 18.7% |
| Median | 9.7% | 12.3% |
| Interquartile 25% (IQ1) | 8.2% | 11.5% |
| Interquartile 75% (IQ3) | 10.9% | 16.7% |
| Interquartile Range (IQR) | 2.7% | 5.2% |
| Standard Deviation (Sample) | 2.5% | 18.4% |
| Standard Deviation (Population) | 2.5% | 18.3% |
Similar Demographics by Male Disability
Demographics Similar to Colombians by Male Disability
In terms of male disability, the demographic groups most similar to Colombians are Ecuadorian (10.5%, a difference of 0.0%), Guyanese (10.5%, a difference of 0.10%), Immigrants from Afghanistan (10.5%, a difference of 0.10%), Immigrants from Grenada (10.5%, a difference of 0.11%), and Jordanian (10.5%, a difference of 0.13%).
| Demographics | Rating | Rank | Male Disability |
| Immigrants | Northern Africa | 99.4 /100 | #61 | Exceptional 10.4% |
| Immigrants | Ecuador | 99.3 /100 | #62 | Exceptional 10.4% |
| Immigrants | Belarus | 99.3 /100 | #63 | Exceptional 10.4% |
| Jordanians | 99.3 /100 | #64 | Exceptional 10.5% |
| Immigrants | Grenada | 99.2 /100 | #65 | Exceptional 10.5% |
| Guyanese | 99.2 /100 | #66 | Exceptional 10.5% |
| Immigrants | Afghanistan | 99.2 /100 | #67 | Exceptional 10.5% |
| Colombians | 99.2 /100 | #68 | Exceptional 10.5% |
| Ecuadorians | 99.2 /100 | #69 | Exceptional 10.5% |
| Immigrants | Bulgaria | 99.1 /100 | #70 | Exceptional 10.5% |
| Immigrants | Cameroon | 99.0 /100 | #71 | Exceptional 10.5% |
| Immigrants | Serbia | 99.0 /100 | #72 | Exceptional 10.5% |
| Immigrants | Lithuania | 98.9 /100 | #73 | Exceptional 10.5% |
| Immigrants | Lebanon | 98.8 /100 | #74 | Exceptional 10.5% |
| Sierra Leoneans | 98.7 /100 | #75 | Exceptional 10.5% |
Demographics Similar to Poles by Male Disability
In terms of male disability, the demographic groups most similar to Poles are Hungarian (12.0%, a difference of 0.18%), Danish (11.9%, a difference of 0.36%), Immigrants from Yemen (12.0%, a difference of 0.36%), Immigrants from Laos (11.9%, a difference of 0.40%), and Immigrants from Liberia (11.9%, a difference of 0.40%).
| Demographics | Rating | Rank | Male Disability |
| Bahamians | 1.1 /100 | #241 | Tragic 11.9% |
| Northern Europeans | 1.1 /100 | #242 | Tragic 11.9% |
| Samoans | 1.1 /100 | #243 | Tragic 11.9% |
| Immigrants | Laos | 1.0 /100 | #244 | Tragic 11.9% |
| Immigrants | Liberia | 1.0 /100 | #245 | Tragic 11.9% |
| Danes | 0.9 /100 | #246 | Tragic 11.9% |
| Hungarians | 0.8 /100 | #247 | Tragic 12.0% |
| Poles | 0.7 /100 | #248 | Tragic 12.0% |
| Immigrants | Yemen | 0.5 /100 | #249 | Tragic 12.0% |
| Bangladeshis | 0.5 /100 | #250 | Tragic 12.0% |
| German Russians | 0.5 /100 | #251 | Tragic 12.0% |
| Slovenes | 0.5 /100 | #252 | Tragic 12.0% |
| Guamanians/Chamorros | 0.5 /100 | #253 | Tragic 12.0% |
| British | 0.4 /100 | #254 | Tragic 12.1% |
| Chinese | 0.4 /100 | #255 | Tragic 12.1% |