Immigrants from Jordan vs Immigrants from Western Africa College, Under 1 year
COMPARE
Immigrants from Jordan
Immigrants from Western Africa
College, Under 1 year
College, Under 1 year Comparison
Immigrants from Jordan
Immigrants from Western Africa
67.3%
COLLEGE, UNDER 1 YEAR
92.8/ 100
METRIC RATING
122nd/ 347
METRIC RANK
62.8%
COLLEGE, UNDER 1 YEAR
2.4/ 100
METRIC RATING
231st/ 347
METRIC RANK
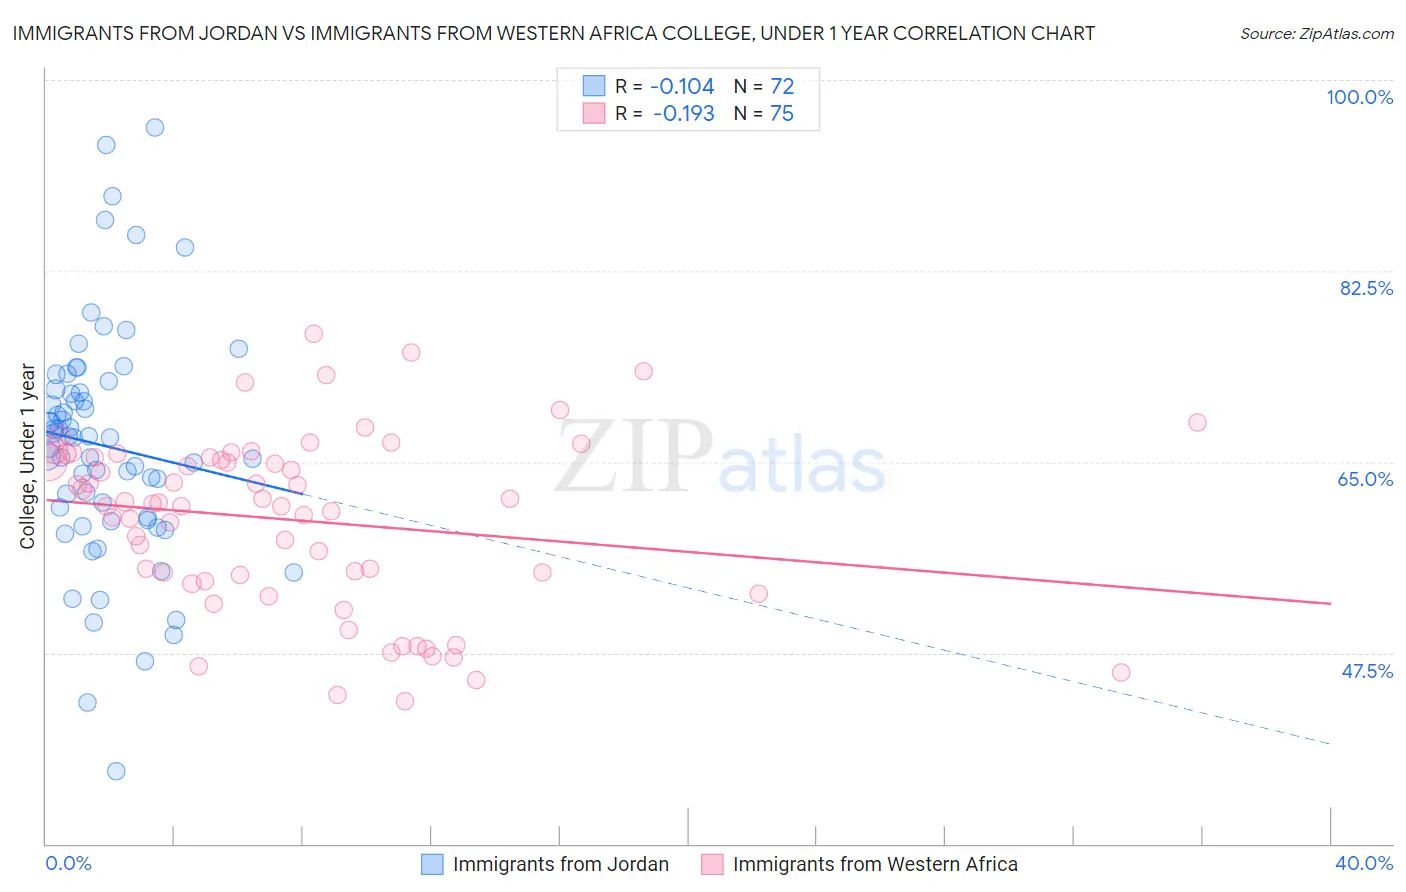
Immigrants from Jordan vs Immigrants from Western Africa College, Under 1 year Correlation Chart
The statistical analysis conducted on geographies consisting of 181,278,834 people shows a poor negative correlation between the proportion of Immigrants from Jordan and percentage of population with at least college, under 1 year education in the United States with a correlation coefficient (R) of -0.104 and weighted average of 67.3%. Similarly, the statistical analysis conducted on geographies consisting of 357,885,062 people shows a poor negative correlation between the proportion of Immigrants from Western Africa and percentage of population with at least college, under 1 year education in the United States with a correlation coefficient (R) of -0.193 and weighted average of 62.8%, a difference of 7.2%.
College, Under 1 year Correlation Summary
| Measurement | Immigrants from Jordan | Immigrants from Western Africa |
| Minimum | 36.7% | 43.0% |
| Maximum | 95.6% | 76.7% |
| Range | 59.0% | 33.7% |
| Mean | 66.5% | 59.7% |
| Median | 67.2% | 61.2% |
| Interquartile 25% (IQ1) | 59.8% | 54.1% |
| Interquartile 75% (IQ3) | 71.5% | 65.4% |
| Interquartile Range (IQR) | 11.7% | 11.4% |
| Standard Deviation (Sample) | 10.8% | 8.0% |
| Standard Deviation (Population) | 10.7% | 7.9% |
Similar Demographics by College, Under 1 year
Demographics Similar to Immigrants from Jordan by College, Under 1 year
In terms of college, under 1 year, the demographic groups most similar to Immigrants from Jordan are Immigrants from Northern Africa (67.2%, a difference of 0.020%), Arab (67.2%, a difference of 0.030%), Slovene (67.3%, a difference of 0.090%), Italian (67.2%, a difference of 0.15%), and Serbian (67.4%, a difference of 0.18%).
| Demographics | Rating | Rank | College, Under 1 year |
| Basques | 95.2 /100 | #115 | Exceptional 67.6% |
| Immigrants | Nepal | 94.9 /100 | #116 | Exceptional 67.5% |
| Pakistanis | 94.8 /100 | #117 | Exceptional 67.5% |
| Immigrants | Ukraine | 94.7 /100 | #118 | Exceptional 67.5% |
| Lebanese | 94.6 /100 | #119 | Exceptional 67.5% |
| Serbians | 93.9 /100 | #120 | Exceptional 67.4% |
| Slovenes | 93.3 /100 | #121 | Exceptional 67.3% |
| Immigrants | Jordan | 92.8 /100 | #122 | Exceptional 67.3% |
| Immigrants | Northern Africa | 92.7 /100 | #123 | Exceptional 67.2% |
| Arabs | 92.6 /100 | #124 | Exceptional 67.2% |
| Italians | 91.8 /100 | #125 | Exceptional 67.2% |
| Alsatians | 91.3 /100 | #126 | Exceptional 67.1% |
| Czechs | 90.8 /100 | #127 | Exceptional 67.1% |
| Scottish | 90.2 /100 | #128 | Exceptional 67.0% |
| Immigrants | Eastern Africa | 89.5 /100 | #129 | Excellent 67.0% |
Demographics Similar to Immigrants from Western Africa by College, Under 1 year
In terms of college, under 1 year, the demographic groups most similar to Immigrants from Western Africa are Osage (62.7%, a difference of 0.11%), Iroquois (62.6%, a difference of 0.22%), Nonimmigrants (62.9%, a difference of 0.24%), Chippewa (62.6%, a difference of 0.26%), and Liberian (63.0%, a difference of 0.31%).
| Demographics | Rating | Rank | College, Under 1 year |
| Sub-Saharan Africans | 4.4 /100 | #224 | Tragic 63.2% |
| Immigrants | Peru | 4.0 /100 | #225 | Tragic 63.1% |
| Immigrants | Colombia | 4.0 /100 | #226 | Tragic 63.1% |
| Immigrants | Ghana | 3.7 /100 | #227 | Tragic 63.1% |
| Samoans | 3.3 /100 | #228 | Tragic 63.0% |
| Liberians | 3.2 /100 | #229 | Tragic 63.0% |
| Immigrants | Nonimmigrants | 3.0 /100 | #230 | Tragic 62.9% |
| Immigrants | Western Africa | 2.4 /100 | #231 | Tragic 62.8% |
| Osage | 2.2 /100 | #232 | Tragic 62.7% |
| Iroquois | 2.0 /100 | #233 | Tragic 62.6% |
| Chippewa | 2.0 /100 | #234 | Tragic 62.6% |
| Spanish Americans | 1.9 /100 | #235 | Tragic 62.6% |
| Immigrants | Immigrants | 1.7 /100 | #236 | Tragic 62.5% |
| Immigrants | Burma/Myanmar | 1.6 /100 | #237 | Tragic 62.5% |
| French American Indians | 1.5 /100 | #238 | Tragic 62.4% |