Immigrants from Jordan vs Immigrants from Western Africa No Schooling Completed
COMPARE
Immigrants from Jordan
Immigrants from Western Africa
No Schooling Completed
No Schooling Completed Comparison
Immigrants from Jordan
Immigrants from Western Africa
2.0%
NO SCHOOLING COMPLETED
70.9/ 100
METRIC RATING
151st/ 347
METRIC RANK
2.6%
NO SCHOOLING COMPLETED
0.1/ 100
METRIC RATING
276th/ 347
METRIC RANK
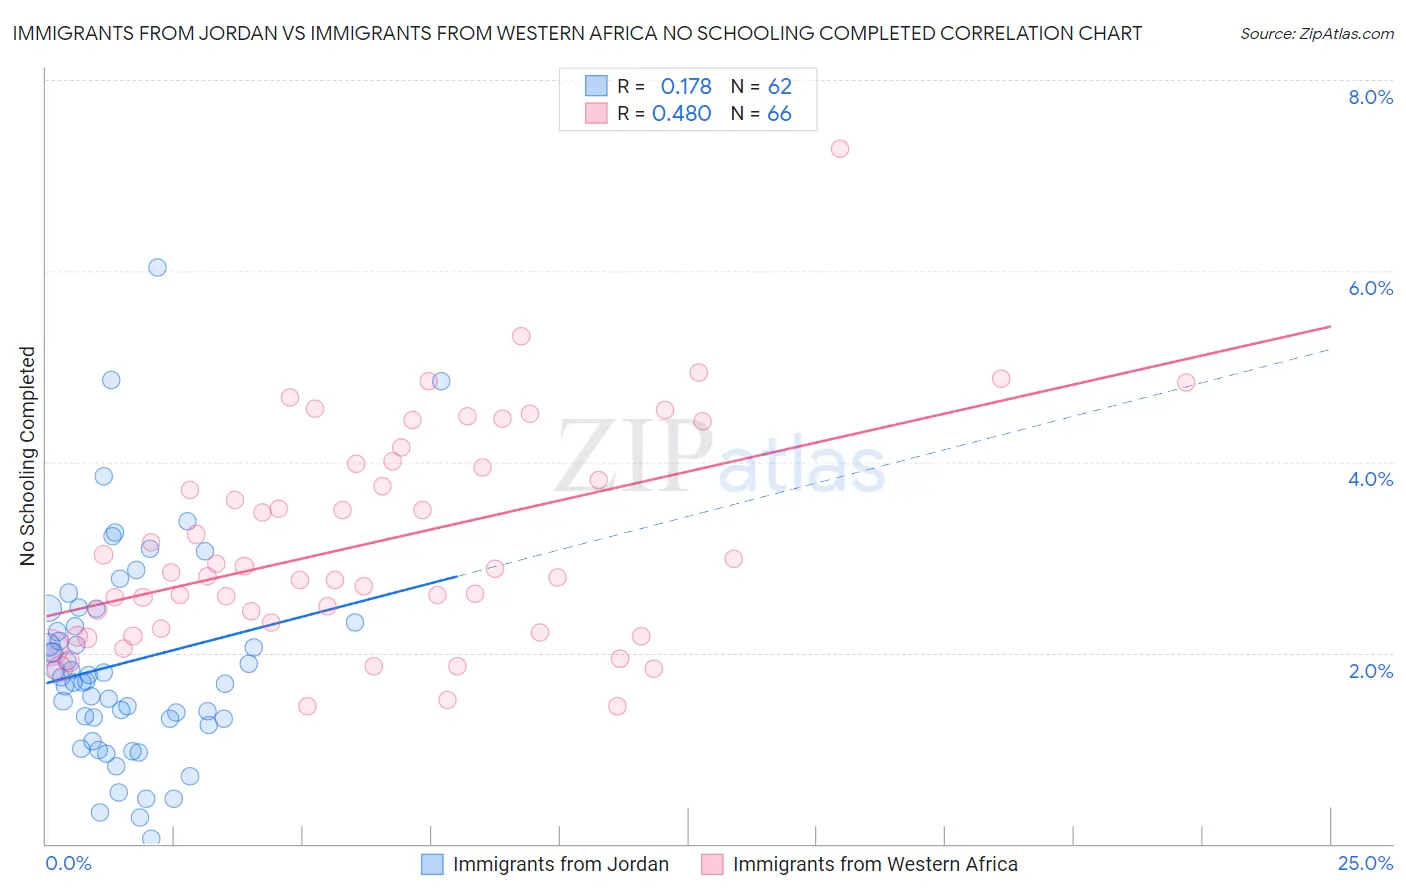
Immigrants from Jordan vs Immigrants from Western Africa No Schooling Completed Correlation Chart
The statistical analysis conducted on geographies consisting of 180,880,658 people shows a poor positive correlation between the proportion of Immigrants from Jordan and percentage of population with no schooling in the United States with a correlation coefficient (R) of 0.178 and weighted average of 2.0%. Similarly, the statistical analysis conducted on geographies consisting of 355,413,927 people shows a moderate positive correlation between the proportion of Immigrants from Western Africa and percentage of population with no schooling in the United States with a correlation coefficient (R) of 0.480 and weighted average of 2.6%, a difference of 27.0%.
No Schooling Completed Correlation Summary
| Measurement | Immigrants from Jordan | Immigrants from Western Africa |
| Minimum | 0.047% | 1.4% |
| Maximum | 6.0% | 7.3% |
| Range | 6.0% | 5.8% |
| Mean | 1.9% | 3.2% |
| Median | 1.7% | 2.9% |
| Interquartile 25% (IQ1) | 1.3% | 2.3% |
| Interquartile 75% (IQ3) | 2.3% | 4.0% |
| Interquartile Range (IQR) | 1.0% | 1.7% |
| Standard Deviation (Sample) | 1.1% | 1.1% |
| Standard Deviation (Population) | 1.1% | 1.1% |
Similar Demographics by No Schooling Completed
Demographics Similar to Immigrants from Jordan by No Schooling Completed
In terms of no schooling completed, the demographic groups most similar to Immigrants from Jordan are Immigrants from Eastern Europe (2.0%, a difference of 0.090%), Immigrants from Italy (2.0%, a difference of 0.33%), Blackfeet (2.0%, a difference of 0.34%), Immigrants from Venezuela (2.0%, a difference of 0.39%), and Immigrants from Russia (2.0%, a difference of 0.53%).
| Demographics | Rating | Rank | No Schooling Completed |
| Alsatians | 79.1 /100 | #144 | Good 2.0% |
| Immigrants | Iran | 79.0 /100 | #145 | Good 2.0% |
| Immigrants | Moldova | 78.0 /100 | #146 | Good 2.0% |
| Soviet Union | 77.1 /100 | #147 | Good 2.0% |
| Shoshone | 76.7 /100 | #148 | Good 2.0% |
| Immigrants | North Macedonia | 75.9 /100 | #149 | Good 2.0% |
| Blackfeet | 72.9 /100 | #150 | Good 2.0% |
| Immigrants | Jordan | 70.9 /100 | #151 | Good 2.0% |
| Immigrants | Eastern Europe | 70.4 /100 | #152 | Good 2.0% |
| Immigrants | Italy | 68.9 /100 | #153 | Good 2.0% |
| Immigrants | Venezuela | 68.5 /100 | #154 | Good 2.0% |
| Immigrants | Russia | 67.6 /100 | #155 | Good 2.0% |
| Chileans | 67.2 /100 | #156 | Good 2.0% |
| Immigrants | Sri Lanka | 67.0 /100 | #157 | Good 2.0% |
| Immigrants | Korea | 66.7 /100 | #158 | Good 2.0% |
Demographics Similar to Immigrants from Western Africa by No Schooling Completed
In terms of no schooling completed, the demographic groups most similar to Immigrants from Western Africa are Immigrants from Philippines (2.6%, a difference of 0.050%), Immigrants from Uzbekistan (2.6%, a difference of 0.25%), Immigrants from China (2.6%, a difference of 0.56%), Ghanaian (2.6%, a difference of 0.74%), and Barbadian (2.6%, a difference of 0.80%).
| Demographics | Rating | Rank | No Schooling Completed |
| Immigrants | Nigeria | 0.2 /100 | #269 | Tragic 2.5% |
| Immigrants | Peru | 0.2 /100 | #270 | Tragic 2.5% |
| Cubans | 0.2 /100 | #271 | Tragic 2.5% |
| Immigrants | Bolivia | 0.2 /100 | #272 | Tragic 2.5% |
| Immigrants | Cameroon | 0.1 /100 | #273 | Tragic 2.5% |
| Ghanaians | 0.1 /100 | #274 | Tragic 2.6% |
| Immigrants | China | 0.1 /100 | #275 | Tragic 2.6% |
| Immigrants | Western Africa | 0.1 /100 | #276 | Tragic 2.6% |
| Immigrants | Philippines | 0.1 /100 | #277 | Tragic 2.6% |
| Immigrants | Uzbekistan | 0.1 /100 | #278 | Tragic 2.6% |
| Barbadians | 0.1 /100 | #279 | Tragic 2.6% |
| Trinidadians and Tobagonians | 0.1 /100 | #280 | Tragic 2.6% |
| Afghans | 0.1 /100 | #281 | Tragic 2.6% |
| Immigrants | Ghana | 0.1 /100 | #282 | Tragic 2.6% |
| Immigrants | Trinidad and Tobago | 0.0 /100 | #283 | Tragic 2.6% |