Haitian vs Immigrants from Eritrea Disability Age 5 to 17
COMPARE
Haitian
Immigrants from Eritrea
Disability Age 5 to 17
Disability Age 5 to 17 Comparison
Haitians
Immigrants from Eritrea
5.8%
DISABILITY AGE 5 TO 17
4.8/ 100
METRIC RATING
228th/ 347
METRIC RANK
5.3%
DISABILITY AGE 5 TO 17
98.0/ 100
METRIC RATING
110th/ 347
METRIC RANK
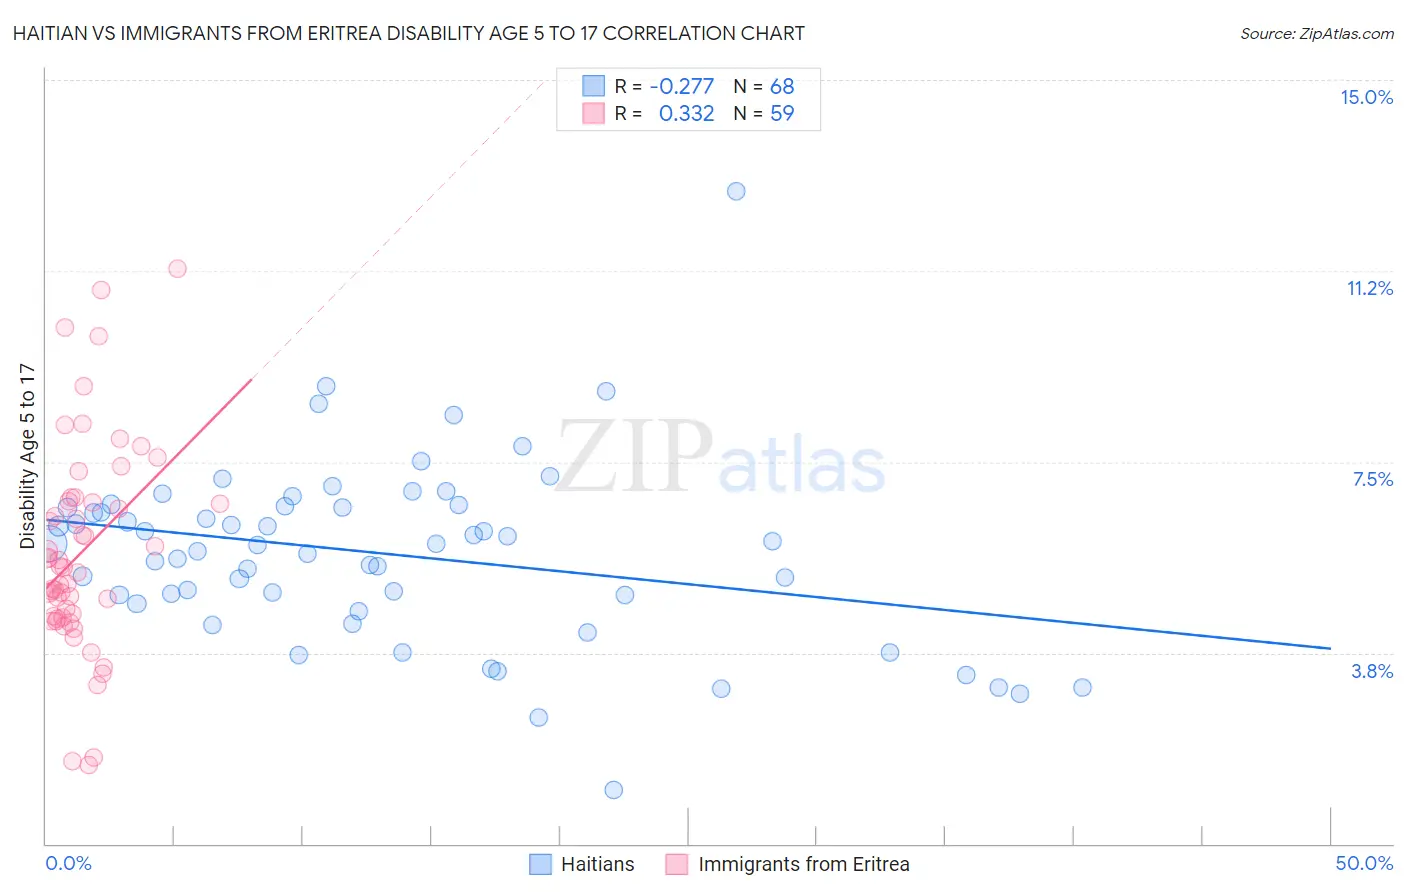
Haitian vs Immigrants from Eritrea Disability Age 5 to 17 Correlation Chart
The statistical analysis conducted on geographies consisting of 286,241,081 people shows a weak negative correlation between the proportion of Haitians and percentage of population with a disability between the ages 5 and 17 in the United States with a correlation coefficient (R) of -0.277 and weighted average of 5.8%. Similarly, the statistical analysis conducted on geographies consisting of 104,672,800 people shows a mild positive correlation between the proportion of Immigrants from Eritrea and percentage of population with a disability between the ages 5 and 17 in the United States with a correlation coefficient (R) of 0.332 and weighted average of 5.3%, a difference of 8.9%.
Disability Age 5 to 17 Correlation Summary
| Measurement | Haitian | Immigrants from Eritrea |
| Minimum | 1.1% | 1.5% |
| Maximum | 12.8% | 11.3% |
| Range | 11.7% | 9.8% |
| Mean | 5.7% | 5.7% |
| Median | 5.9% | 5.4% |
| Interquartile 25% (IQ1) | 4.8% | 4.4% |
| Interquartile 75% (IQ3) | 6.6% | 6.7% |
| Interquartile Range (IQR) | 1.8% | 2.3% |
| Standard Deviation (Sample) | 1.8% | 2.0% |
| Standard Deviation (Population) | 1.8% | 2.0% |
Similar Demographics by Disability Age 5 to 17
Demographics Similar to Haitians by Disability Age 5 to 17
In terms of disability age 5 to 17, the demographic groups most similar to Haitians are Bangladeshi (5.8%, a difference of 0.010%), Ghanaian (5.8%, a difference of 0.020%), Swiss (5.8%, a difference of 0.080%), European (5.8%, a difference of 0.090%), and British West Indian (5.8%, a difference of 0.16%).
| Demographics | Rating | Rank | Disability Age 5 to 17 |
| Lithuanians | 6.7 /100 | #221 | Tragic 5.8% |
| Immigrants | Sudan | 6.7 /100 | #222 | Tragic 5.8% |
| Alsatians | 6.0 /100 | #223 | Tragic 5.8% |
| Mexicans | 5.7 /100 | #224 | Tragic 5.8% |
| Guamanians/Chamorros | 5.6 /100 | #225 | Tragic 5.8% |
| British West Indians | 5.4 /100 | #226 | Tragic 5.8% |
| Swiss | 5.1 /100 | #227 | Tragic 5.8% |
| Haitians | 4.8 /100 | #228 | Tragic 5.8% |
| Bangladeshis | 4.8 /100 | #229 | Tragic 5.8% |
| Ghanaians | 4.7 /100 | #230 | Tragic 5.8% |
| Europeans | 4.5 /100 | #231 | Tragic 5.8% |
| Immigrants | Laos | 3.8 /100 | #232 | Tragic 5.8% |
| Immigrants | West Indies | 3.5 /100 | #233 | Tragic 5.8% |
| Immigrants | Kenya | 3.4 /100 | #234 | Tragic 5.8% |
| Malaysians | 3.4 /100 | #235 | Tragic 5.8% |
Demographics Similar to Immigrants from Eritrea by Disability Age 5 to 17
In terms of disability age 5 to 17, the demographic groups most similar to Immigrants from Eritrea are Immigrants from Northern Africa (5.3%, a difference of 0.040%), Ethiopian (5.3%, a difference of 0.040%), Immigrants from Latvia (5.3%, a difference of 0.050%), Immigrants from South Africa (5.3%, a difference of 0.080%), and Aleut (5.3%, a difference of 0.10%).
| Demographics | Rating | Rank | Disability Age 5 to 17 |
| Salvadorans | 98.6 /100 | #103 | Exceptional 5.3% |
| Peruvians | 98.5 /100 | #104 | Exceptional 5.3% |
| Immigrants | Italy | 98.4 /100 | #105 | Exceptional 5.3% |
| Immigrants | Yemen | 98.2 /100 | #106 | Exceptional 5.3% |
| Russians | 98.2 /100 | #107 | Exceptional 5.3% |
| Immigrants | South Africa | 98.1 /100 | #108 | Exceptional 5.3% |
| Immigrants | Northern Africa | 98.1 /100 | #109 | Exceptional 5.3% |
| Immigrants | Eritrea | 98.0 /100 | #110 | Exceptional 5.3% |
| Ethiopians | 97.9 /100 | #111 | Exceptional 5.3% |
| Immigrants | Latvia | 97.9 /100 | #112 | Exceptional 5.3% |
| Aleuts | 97.8 /100 | #113 | Exceptional 5.3% |
| Immigrants | Northern Europe | 97.8 /100 | #114 | Exceptional 5.3% |
| Cubans | 97.8 /100 | #115 | Exceptional 5.3% |
| Cypriots | 97.7 /100 | #116 | Exceptional 5.3% |
| Immigrants | Afghanistan | 97.4 /100 | #117 | Exceptional 5.3% |