Central American Indian vs Immigrants from Eritrea Disability Age 5 to 17
COMPARE
Central American Indian
Immigrants from Eritrea
Disability Age 5 to 17
Disability Age 5 to 17 Comparison
Central American Indians
Immigrants from Eritrea
6.2%
DISABILITY AGE 5 TO 17
0.0/ 100
METRIC RATING
293rd/ 347
METRIC RANK
5.3%
DISABILITY AGE 5 TO 17
98.0/ 100
METRIC RATING
110th/ 347
METRIC RANK
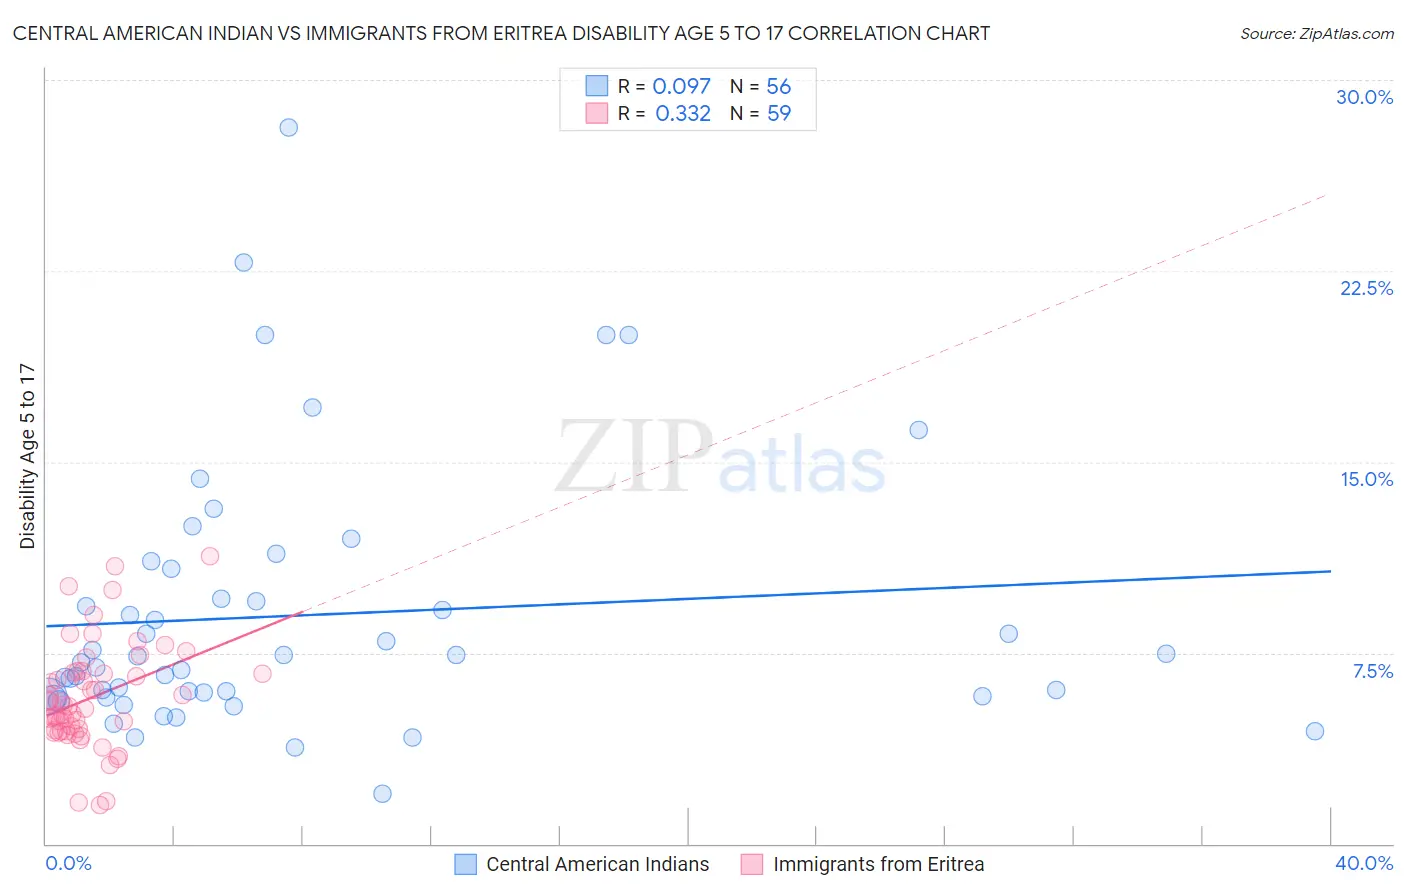
Central American Indian vs Immigrants from Eritrea Disability Age 5 to 17 Correlation Chart
The statistical analysis conducted on geographies consisting of 324,856,277 people shows a slight positive correlation between the proportion of Central American Indians and percentage of population with a disability between the ages 5 and 17 in the United States with a correlation coefficient (R) of 0.097 and weighted average of 6.2%. Similarly, the statistical analysis conducted on geographies consisting of 104,672,800 people shows a mild positive correlation between the proportion of Immigrants from Eritrea and percentage of population with a disability between the ages 5 and 17 in the United States with a correlation coefficient (R) of 0.332 and weighted average of 5.3%, a difference of 16.6%.
Disability Age 5 to 17 Correlation Summary
| Measurement | Central American Indian | Immigrants from Eritrea |
| Minimum | 2.0% | 1.5% |
| Maximum | 28.1% | 11.3% |
| Range | 26.2% | 9.8% |
| Mean | 9.0% | 5.7% |
| Median | 7.2% | 5.4% |
| Interquartile 25% (IQ1) | 5.8% | 4.4% |
| Interquartile 75% (IQ3) | 10.2% | 6.7% |
| Interquartile Range (IQR) | 4.4% | 2.3% |
| Standard Deviation (Sample) | 5.2% | 2.0% |
| Standard Deviation (Population) | 5.2% | 2.0% |
Similar Demographics by Disability Age 5 to 17
Demographics Similar to Central American Indians by Disability Age 5 to 17
In terms of disability age 5 to 17, the demographic groups most similar to Central American Indians are Irish (6.2%, a difference of 0.0%), Immigrants from Senegal (6.2%, a difference of 0.020%), White/Caucasian (6.2%, a difference of 0.26%), Cree (6.2%, a difference of 0.28%), and Spanish American (6.2%, a difference of 0.30%).
| Demographics | Rating | Rank | Disability Age 5 to 17 |
| Colville | 0.0 /100 | #286 | Tragic 6.2% |
| Pima | 0.0 /100 | #287 | Tragic 6.2% |
| Jamaicans | 0.0 /100 | #288 | Tragic 6.2% |
| Yaqui | 0.0 /100 | #289 | Tragic 6.2% |
| Immigrants | Congo | 0.0 /100 | #290 | Tragic 6.2% |
| Whites/Caucasians | 0.0 /100 | #291 | Tragic 6.2% |
| Immigrants | Senegal | 0.0 /100 | #292 | Tragic 6.2% |
| Central American Indians | 0.0 /100 | #293 | Tragic 6.2% |
| Irish | 0.0 /100 | #294 | Tragic 6.2% |
| Cree | 0.0 /100 | #295 | Tragic 6.2% |
| Spanish Americans | 0.0 /100 | #296 | Tragic 6.2% |
| Immigrants | Bahamas | 0.0 /100 | #297 | Tragic 6.2% |
| Lumbee | 0.0 /100 | #298 | Tragic 6.2% |
| Welsh | 0.0 /100 | #299 | Tragic 6.3% |
| Carpatho Rusyns | 0.0 /100 | #300 | Tragic 6.3% |
Demographics Similar to Immigrants from Eritrea by Disability Age 5 to 17
In terms of disability age 5 to 17, the demographic groups most similar to Immigrants from Eritrea are Immigrants from Northern Africa (5.3%, a difference of 0.040%), Ethiopian (5.3%, a difference of 0.040%), Immigrants from Latvia (5.3%, a difference of 0.050%), Immigrants from South Africa (5.3%, a difference of 0.080%), and Aleut (5.3%, a difference of 0.10%).
| Demographics | Rating | Rank | Disability Age 5 to 17 |
| Salvadorans | 98.6 /100 | #103 | Exceptional 5.3% |
| Peruvians | 98.5 /100 | #104 | Exceptional 5.3% |
| Immigrants | Italy | 98.4 /100 | #105 | Exceptional 5.3% |
| Immigrants | Yemen | 98.2 /100 | #106 | Exceptional 5.3% |
| Russians | 98.2 /100 | #107 | Exceptional 5.3% |
| Immigrants | South Africa | 98.1 /100 | #108 | Exceptional 5.3% |
| Immigrants | Northern Africa | 98.1 /100 | #109 | Exceptional 5.3% |
| Immigrants | Eritrea | 98.0 /100 | #110 | Exceptional 5.3% |
| Ethiopians | 97.9 /100 | #111 | Exceptional 5.3% |
| Immigrants | Latvia | 97.9 /100 | #112 | Exceptional 5.3% |
| Aleuts | 97.8 /100 | #113 | Exceptional 5.3% |
| Immigrants | Northern Europe | 97.8 /100 | #114 | Exceptional 5.3% |
| Cubans | 97.8 /100 | #115 | Exceptional 5.3% |
| Cypriots | 97.7 /100 | #116 | Exceptional 5.3% |
| Immigrants | Afghanistan | 97.4 /100 | #117 | Exceptional 5.3% |