Immigrants from Israel vs Native/Alaskan Cognitive Disability
COMPARE
Immigrants from Israel
Native/Alaskan
Cognitive Disability
Cognitive Disability Comparison
Immigrants from Israel
Natives/Alaskans
16.4%
COGNITIVE DISABILITY
99.9/ 100
METRIC RATING
32nd/ 347
METRIC RANK
18.1%
COGNITIVE DISABILITY
0.1/ 100
METRIC RATING
289th/ 347
METRIC RANK
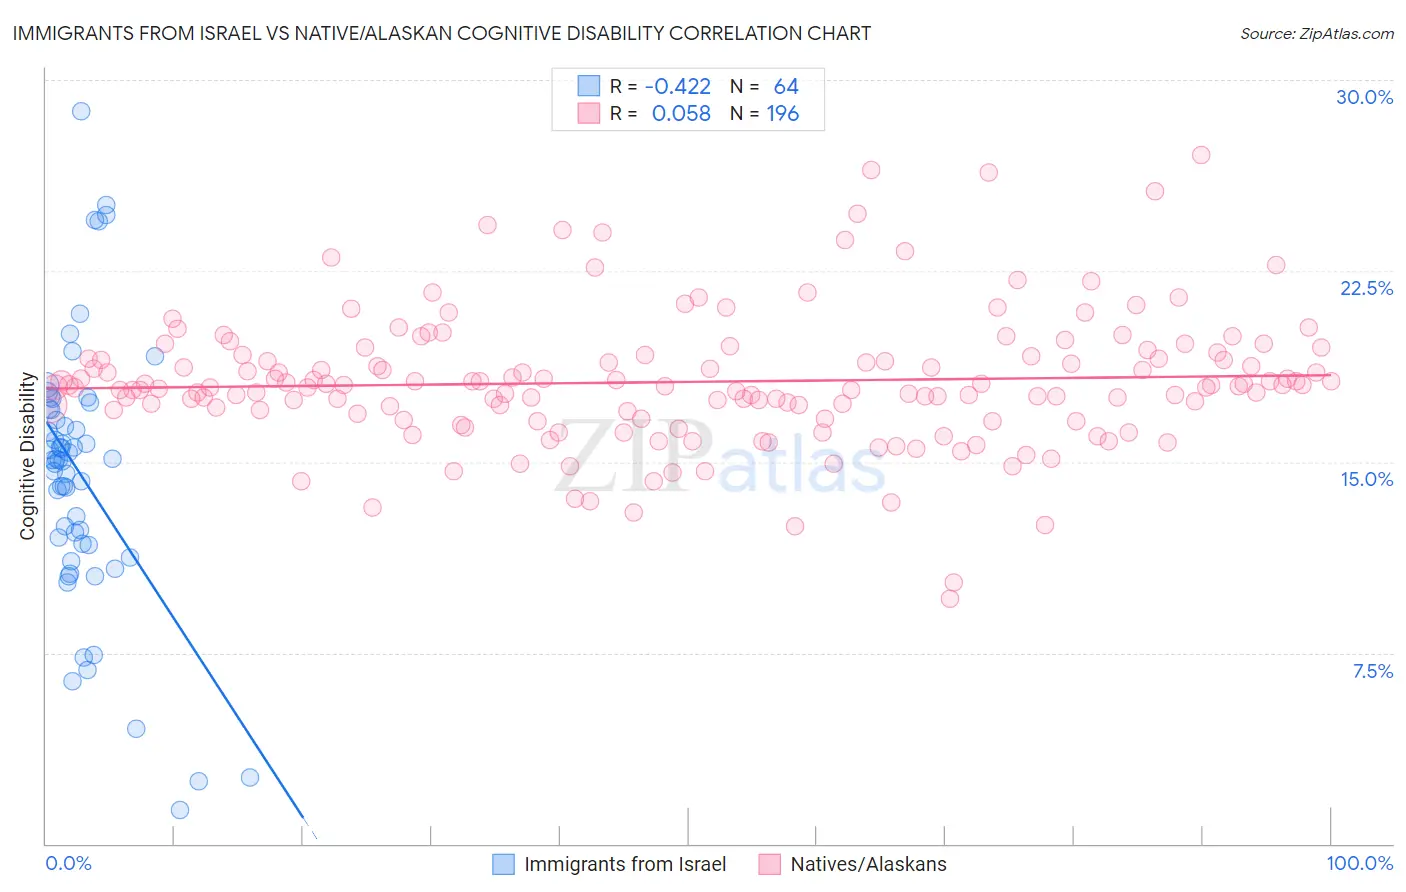
Immigrants from Israel vs Native/Alaskan Cognitive Disability Correlation Chart
The statistical analysis conducted on geographies consisting of 210,028,884 people shows a moderate negative correlation between the proportion of Immigrants from Israel and percentage of population with cognitive disability in the United States with a correlation coefficient (R) of -0.422 and weighted average of 16.4%. Similarly, the statistical analysis conducted on geographies consisting of 512,906,873 people shows a slight positive correlation between the proportion of Natives/Alaskans and percentage of population with cognitive disability in the United States with a correlation coefficient (R) of 0.058 and weighted average of 18.1%, a difference of 10.6%.
Cognitive Disability Correlation Summary
| Measurement | Immigrants from Israel | Native/Alaskan |
| Minimum | 1.3% | 9.6% |
| Maximum | 28.8% | 27.1% |
| Range | 27.5% | 17.4% |
| Mean | 14.5% | 18.1% |
| Median | 15.1% | 18.0% |
| Interquartile 25% (IQ1) | 11.8% | 16.9% |
| Interquartile 75% (IQ3) | 17.0% | 19.2% |
| Interquartile Range (IQR) | 5.3% | 2.2% |
| Standard Deviation (Sample) | 5.3% | 2.6% |
| Standard Deviation (Population) | 5.2% | 2.6% |
Similar Demographics by Cognitive Disability
Demographics Similar to Immigrants from Israel by Cognitive Disability
In terms of cognitive disability, the demographic groups most similar to Immigrants from Israel are Immigrants from Romania (16.4%, a difference of 0.050%), Czech (16.4%, a difference of 0.070%), Italian (16.4%, a difference of 0.070%), Filipino (16.4%, a difference of 0.080%), and Russian (16.4%, a difference of 0.080%).
| Demographics | Rating | Rank | Cognitive Disability |
| Luxembourgers | 99.9 /100 | #25 | Exceptional 16.4% |
| Immigrants | Croatia | 99.9 /100 | #26 | Exceptional 16.4% |
| Immigrants | Pakistan | 99.9 /100 | #27 | Exceptional 16.4% |
| Poles | 99.9 /100 | #28 | Exceptional 16.4% |
| Filipinos | 99.9 /100 | #29 | Exceptional 16.4% |
| Czechs | 99.9 /100 | #30 | Exceptional 16.4% |
| Immigrants | Romania | 99.9 /100 | #31 | Exceptional 16.4% |
| Immigrants | Israel | 99.9 /100 | #32 | Exceptional 16.4% |
| Italians | 99.9 /100 | #33 | Exceptional 16.4% |
| Russians | 99.9 /100 | #34 | Exceptional 16.4% |
| Slovaks | 99.9 /100 | #35 | Exceptional 16.4% |
| Greeks | 99.9 /100 | #36 | Exceptional 16.4% |
| Slovenes | 99.9 /100 | #37 | Exceptional 16.5% |
| Immigrants | Eastern Europe | 99.9 /100 | #38 | Exceptional 16.5% |
| Bolivians | 99.9 /100 | #39 | Exceptional 16.5% |
Demographics Similar to Natives/Alaskans by Cognitive Disability
In terms of cognitive disability, the demographic groups most similar to Natives/Alaskans are Immigrants from West Indies (18.1%, a difference of 0.010%), Dutch West Indian (18.1%, a difference of 0.020%), Immigrants from Africa (18.1%, a difference of 0.030%), Kenyan (18.1%, a difference of 0.060%), and Bermudan (18.1%, a difference of 0.10%).
| Demographics | Rating | Rank | Cognitive Disability |
| Immigrants | Cambodia | 0.1 /100 | #282 | Tragic 18.1% |
| Nigerians | 0.1 /100 | #283 | Tragic 18.1% |
| Immigrants | Uganda | 0.1 /100 | #284 | Tragic 18.1% |
| Bermudans | 0.1 /100 | #285 | Tragic 18.1% |
| Kenyans | 0.1 /100 | #286 | Tragic 18.1% |
| Dutch West Indians | 0.1 /100 | #287 | Tragic 18.1% |
| Immigrants | West Indies | 0.1 /100 | #288 | Tragic 18.1% |
| Natives/Alaskans | 0.1 /100 | #289 | Tragic 18.1% |
| Immigrants | Africa | 0.1 /100 | #290 | Tragic 18.1% |
| Ottawa | 0.1 /100 | #291 | Tragic 18.2% |
| Iroquois | 0.1 /100 | #292 | Tragic 18.2% |
| Central American Indians | 0.1 /100 | #293 | Tragic 18.2% |
| British West Indians | 0.1 /100 | #294 | Tragic 18.2% |
| German Russians | 0.0 /100 | #295 | Tragic 18.2% |
| Immigrants | Burma/Myanmar | 0.0 /100 | #296 | Tragic 18.2% |