Immigrants from Israel vs Houma High School Diploma
COMPARE
Immigrants from Israel
Houma
High School Diploma
High School Diploma Comparison
Immigrants from Israel
Houma
90.5%
HIGH SCHOOL DIPLOMA
98.5/ 100
METRIC RATING
94th/ 347
METRIC RANK
81.5%
HIGH SCHOOL DIPLOMA
0.0/ 100
METRIC RATING
340th/ 347
METRIC RANK
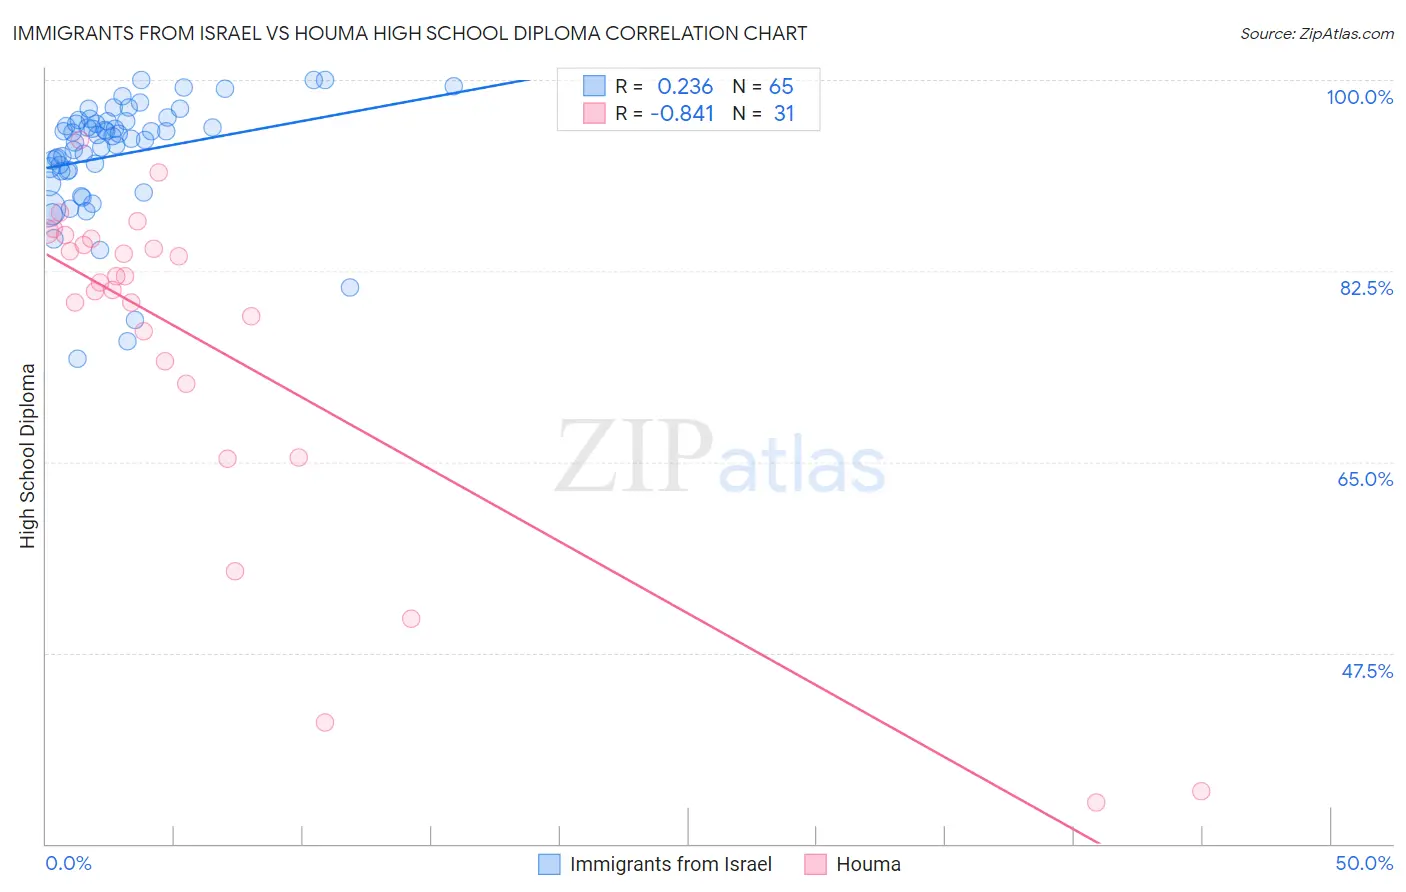
Immigrants from Israel vs Houma High School Diploma Correlation Chart
The statistical analysis conducted on geographies consisting of 210,029,020 people shows a weak positive correlation between the proportion of Immigrants from Israel and percentage of population with at least high school diploma education in the United States with a correlation coefficient (R) of 0.236 and weighted average of 90.5%. Similarly, the statistical analysis conducted on geographies consisting of 36,795,916 people shows a very strong negative correlation between the proportion of Houma and percentage of population with at least high school diploma education in the United States with a correlation coefficient (R) of -0.841 and weighted average of 81.5%, a difference of 11.1%.
High School Diploma Correlation Summary
| Measurement | Immigrants from Israel | Houma |
| Minimum | 74.4% | 33.8% |
| Maximum | 100.0% | 94.5% |
| Range | 25.6% | 60.8% |
| Mean | 93.1% | 75.5% |
| Median | 94.8% | 81.4% |
| Interquartile 25% (IQ1) | 91.7% | 72.2% |
| Interquartile 75% (IQ3) | 96.2% | 85.4% |
| Interquartile Range (IQR) | 4.6% | 13.2% |
| Standard Deviation (Sample) | 5.4% | 16.1% |
| Standard Deviation (Population) | 5.4% | 15.9% |
Similar Demographics by High School Diploma
Demographics Similar to Immigrants from Israel by High School Diploma
In terms of high school diploma, the demographic groups most similar to Immigrants from Israel are Icelander (90.5%, a difference of 0.0%), Immigrants from Serbia (90.5%, a difference of 0.010%), Swiss (90.6%, a difference of 0.020%), Immigrants from Western Europe (90.6%, a difference of 0.020%), and South African (90.6%, a difference of 0.040%).
| Demographics | Rating | Rank | High School Diploma |
| Immigrants | Turkey | 98.9 /100 | #87 | Exceptional 90.6% |
| Immigrants | France | 98.8 /100 | #88 | Exceptional 90.6% |
| Canadians | 98.7 /100 | #89 | Exceptional 90.6% |
| Celtics | 98.7 /100 | #90 | Exceptional 90.6% |
| South Africans | 98.6 /100 | #91 | Exceptional 90.6% |
| Swiss | 98.6 /100 | #92 | Exceptional 90.6% |
| Immigrants | Western Europe | 98.6 /100 | #93 | Exceptional 90.6% |
| Immigrants | Israel | 98.5 /100 | #94 | Exceptional 90.5% |
| Icelanders | 98.5 /100 | #95 | Exceptional 90.5% |
| Immigrants | Serbia | 98.4 /100 | #96 | Exceptional 90.5% |
| Immigrants | Kuwait | 98.3 /100 | #97 | Exceptional 90.5% |
| Immigrants | Korea | 98.3 /100 | #98 | Exceptional 90.5% |
| Immigrants | Europe | 98.2 /100 | #99 | Exceptional 90.5% |
| Immigrants | North Macedonia | 98.1 /100 | #100 | Exceptional 90.5% |
| Immigrants | Norway | 98.0 /100 | #101 | Exceptional 90.5% |
Demographics Similar to Houma by High School Diploma
In terms of high school diploma, the demographic groups most similar to Houma are Pima (81.6%, a difference of 0.11%), Mexican (81.4%, a difference of 0.15%), Salvadoran (81.7%, a difference of 0.20%), Immigrants from Guatemala (81.4%, a difference of 0.20%), and Immigrants from Yemen (81.8%, a difference of 0.38%).
| Demographics | Rating | Rank | High School Diploma |
| Immigrants | Latin America | 0.0 /100 | #333 | Tragic 82.1% |
| Tohono O'odham | 0.0 /100 | #334 | Tragic 82.1% |
| Guatemalans | 0.0 /100 | #335 | Tragic 82.0% |
| Immigrants | Dominican Republic | 0.0 /100 | #336 | Tragic 82.0% |
| Immigrants | Yemen | 0.0 /100 | #337 | Tragic 81.8% |
| Salvadorans | 0.0 /100 | #338 | Tragic 81.7% |
| Pima | 0.0 /100 | #339 | Tragic 81.6% |
| Houma | 0.0 /100 | #340 | Tragic 81.5% |
| Mexicans | 0.0 /100 | #341 | Tragic 81.4% |
| Immigrants | Guatemala | 0.0 /100 | #342 | Tragic 81.4% |
| Immigrants | El Salvador | 0.0 /100 | #343 | Tragic 80.8% |
| Immigrants | Central America | 0.0 /100 | #344 | Tragic 80.1% |
| Yakama | 0.0 /100 | #345 | Tragic 80.0% |
| Spanish American Indians | 0.0 /100 | #346 | Tragic 79.8% |
| Immigrants | Mexico | 0.0 /100 | #347 | Tragic 79.5% |