Immigrants from Israel vs Syrian Male Disability
COMPARE
Immigrants from Israel
Syrian
Male Disability
Male Disability Comparison
Immigrants from Israel
Syrians
9.6%
MALE DISABILITY
100.0/ 100
METRIC RATING
10th/ 347
METRIC RANK
11.2%
MALE DISABILITY
46.6/ 100
METRIC RATING
176th/ 347
METRIC RANK
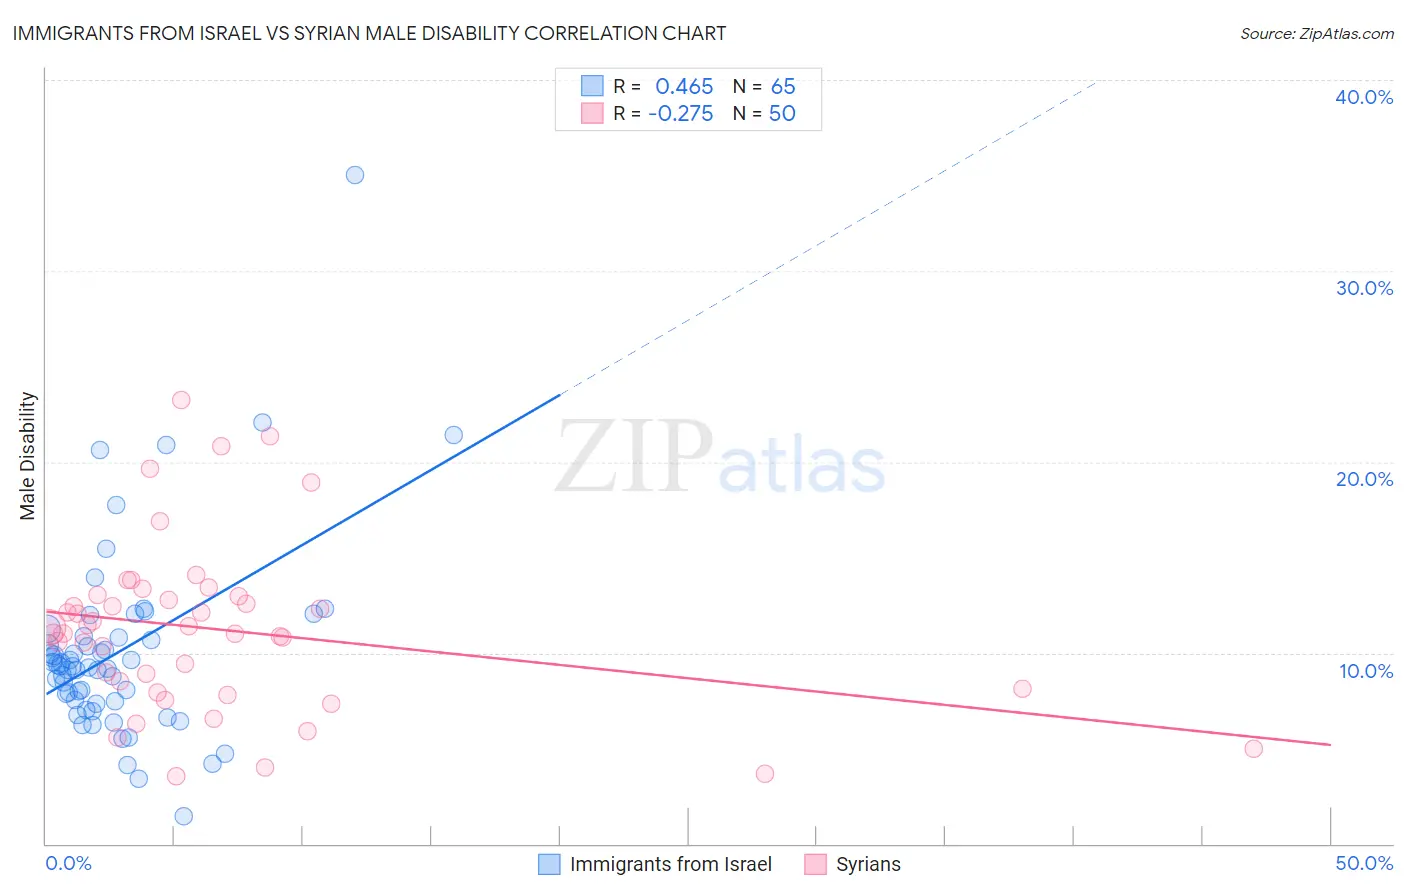
Immigrants from Israel vs Syrian Male Disability Correlation Chart
The statistical analysis conducted on geographies consisting of 210,033,213 people shows a moderate positive correlation between the proportion of Immigrants from Israel and percentage of males with a disability in the United States with a correlation coefficient (R) of 0.465 and weighted average of 9.6%. Similarly, the statistical analysis conducted on geographies consisting of 266,314,155 people shows a weak negative correlation between the proportion of Syrians and percentage of males with a disability in the United States with a correlation coefficient (R) of -0.275 and weighted average of 11.2%, a difference of 17.5%.
Male Disability Correlation Summary
| Measurement | Immigrants from Israel | Syrian |
| Minimum | 1.5% | 3.5% |
| Maximum | 35.0% | 23.2% |
| Range | 33.5% | 19.7% |
| Mean | 10.1% | 11.2% |
| Median | 9.3% | 11.2% |
| Interquartile 25% (IQ1) | 7.4% | 8.1% |
| Interquartile 75% (IQ3) | 10.8% | 12.9% |
| Interquartile Range (IQR) | 3.4% | 4.8% |
| Standard Deviation (Sample) | 5.1% | 4.4% |
| Standard Deviation (Population) | 5.1% | 4.4% |
Similar Demographics by Male Disability
Demographics Similar to Immigrants from Israel by Male Disability
In terms of male disability, the demographic groups most similar to Immigrants from Israel are Immigrants from Singapore (9.5%, a difference of 0.43%), Immigrants from China (9.5%, a difference of 0.51%), Immigrants from Eastern Asia (9.6%, a difference of 0.55%), Bolivian (9.6%, a difference of 0.79%), and Iranian (9.7%, a difference of 1.0%).
| Demographics | Rating | Rank | Male Disability |
| Filipinos | 100.0 /100 | #3 | Exceptional 9.1% |
| Thais | 100.0 /100 | #4 | Exceptional 9.2% |
| Immigrants | Hong Kong | 100.0 /100 | #5 | Exceptional 9.4% |
| Immigrants | South Central Asia | 100.0 /100 | #6 | Exceptional 9.4% |
| Immigrants | Bolivia | 100.0 /100 | #7 | Exceptional 9.5% |
| Immigrants | China | 100.0 /100 | #8 | Exceptional 9.5% |
| Immigrants | Singapore | 100.0 /100 | #9 | Exceptional 9.5% |
| Immigrants | Israel | 100.0 /100 | #10 | Exceptional 9.6% |
| Immigrants | Eastern Asia | 100.0 /100 | #11 | Exceptional 9.6% |
| Bolivians | 100.0 /100 | #12 | Exceptional 9.6% |
| Iranians | 100.0 /100 | #13 | Exceptional 9.7% |
| Immigrants | Iran | 100.0 /100 | #14 | Exceptional 9.7% |
| Indians (Asian) | 100.0 /100 | #15 | Exceptional 9.7% |
| Okinawans | 100.0 /100 | #16 | Exceptional 9.8% |
| Immigrants | Korea | 100.0 /100 | #17 | Exceptional 9.8% |
Demographics Similar to Syrians by Male Disability
In terms of male disability, the demographic groups most similar to Syrians are Immigrants from Honduras (11.2%, a difference of 0.12%), Immigrants from Norway (11.3%, a difference of 0.13%), Maltese (11.2%, a difference of 0.19%), Immigrants from Burma/Myanmar (11.2%, a difference of 0.21%), and Romanian (11.2%, a difference of 0.23%).
| Demographics | Rating | Rank | Male Disability |
| Barbadians | 53.4 /100 | #169 | Average 11.2% |
| New Zealanders | 52.9 /100 | #170 | Average 11.2% |
| Haitians | 52.5 /100 | #171 | Average 11.2% |
| Romanians | 50.7 /100 | #172 | Average 11.2% |
| Immigrants | Burma/Myanmar | 50.4 /100 | #173 | Average 11.2% |
| Maltese | 50.0 /100 | #174 | Average 11.2% |
| Immigrants | Honduras | 48.7 /100 | #175 | Average 11.2% |
| Syrians | 46.6 /100 | #176 | Average 11.2% |
| Immigrants | Norway | 44.2 /100 | #177 | Average 11.3% |
| Australians | 42.2 /100 | #178 | Average 11.3% |
| Immigrants | Caribbean | 41.4 /100 | #179 | Average 11.3% |
| Hondurans | 41.1 /100 | #180 | Average 11.3% |
| Immigrants | Senegal | 34.4 /100 | #181 | Fair 11.3% |
| Immigrants | Belize | 33.7 /100 | #182 | Fair 11.3% |
| Immigrants | Central America | 32.9 /100 | #183 | Fair 11.3% |