Luxembourger vs Immigrants from Venezuela Disability Age 5 to 17
COMPARE
Luxembourger
Immigrants from Venezuela
Disability Age 5 to 17
Disability Age 5 to 17 Comparison
Luxembourgers
Immigrants from Venezuela
5.3%
DISABILITY AGE 5 TO 17
99.2/ 100
METRIC RATING
92nd/ 347
METRIC RANK
5.4%
DISABILITY AGE 5 TO 17
94.5/ 100
METRIC RATING
128th/ 347
METRIC RANK
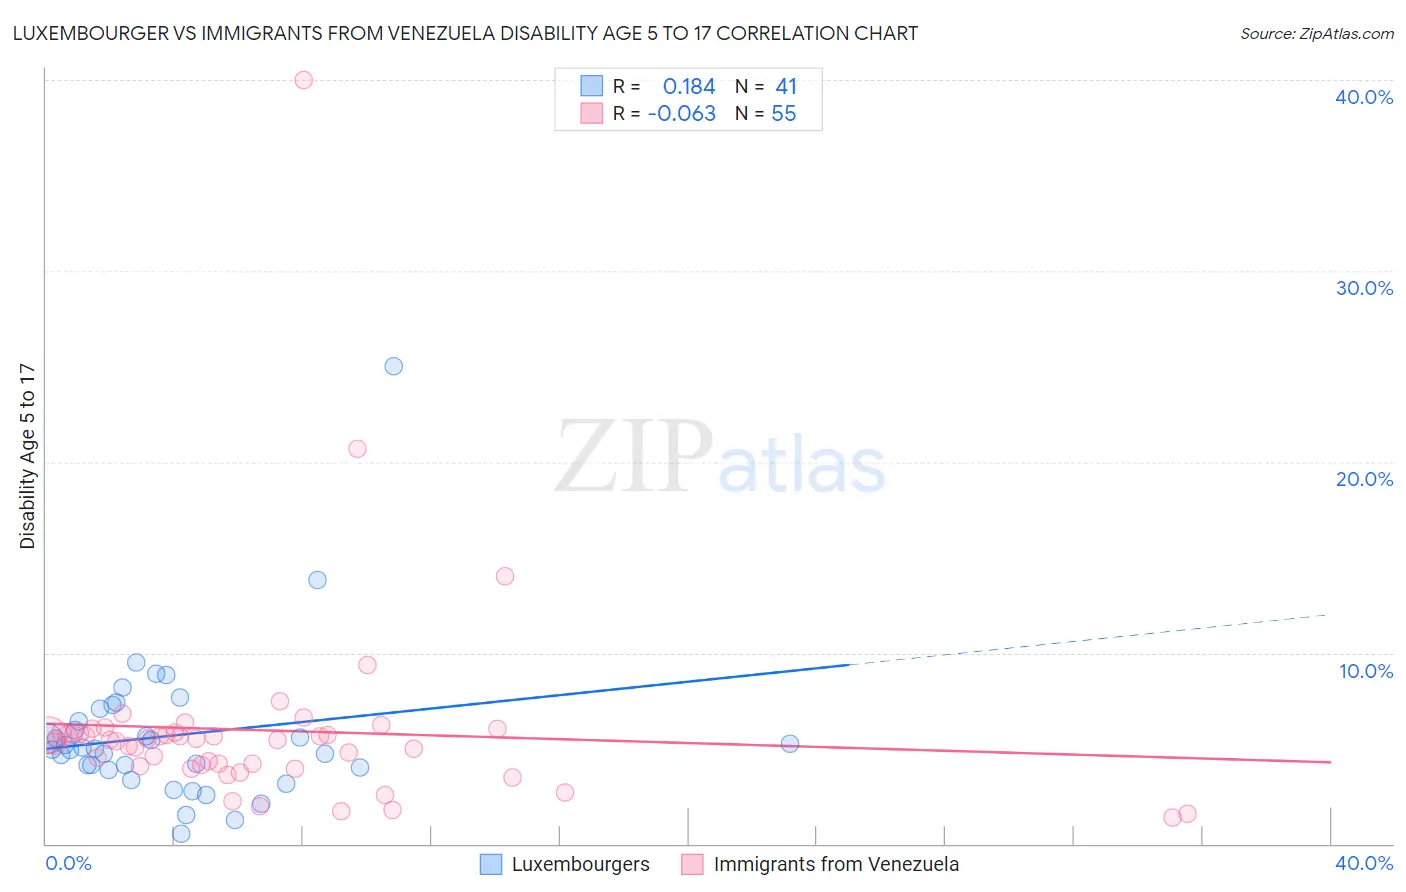
Luxembourger vs Immigrants from Venezuela Disability Age 5 to 17 Correlation Chart
The statistical analysis conducted on geographies consisting of 143,736,782 people shows a poor positive correlation between the proportion of Luxembourgers and percentage of population with a disability between the ages 5 and 17 in the United States with a correlation coefficient (R) of 0.184 and weighted average of 5.3%. Similarly, the statistical analysis conducted on geographies consisting of 286,570,135 people shows a slight negative correlation between the proportion of Immigrants from Venezuela and percentage of population with a disability between the ages 5 and 17 in the United States with a correlation coefficient (R) of -0.063 and weighted average of 5.4%, a difference of 2.6%.
Disability Age 5 to 17 Correlation Summary
| Measurement | Luxembourger | Immigrants from Venezuela |
| Minimum | 0.53% | 1.4% |
| Maximum | 25.0% | 40.0% |
| Range | 24.5% | 38.6% |
| Mean | 5.7% | 5.9% |
| Median | 5.0% | 5.5% |
| Interquartile 25% (IQ1) | 3.9% | 4.1% |
| Interquartile 75% (IQ3) | 6.8% | 5.8% |
| Interquartile Range (IQR) | 2.8% | 1.8% |
| Standard Deviation (Sample) | 4.0% | 5.5% |
| Standard Deviation (Population) | 3.9% | 5.5% |
Similar Demographics by Disability Age 5 to 17
Demographics Similar to Luxembourgers by Disability Age 5 to 17
In terms of disability age 5 to 17, the demographic groups most similar to Luxembourgers are Mongolian (5.3%, a difference of 0.010%), Immigrants from Peru (5.3%, a difference of 0.080%), Immigrants from Jordan (5.3%, a difference of 0.14%), Immigrants from Grenada (5.3%, a difference of 0.16%), and Immigrants from Kuwait (5.3%, a difference of 0.30%).
| Demographics | Rating | Rank | Disability Age 5 to 17 |
| Bulgarians | 99.4 /100 | #85 | Exceptional 5.2% |
| Immigrants | St. Vincent and the Grenadines | 99.4 /100 | #86 | Exceptional 5.2% |
| Eastern Europeans | 99.4 /100 | #87 | Exceptional 5.2% |
| Immigrants | Croatia | 99.4 /100 | #88 | Exceptional 5.2% |
| Immigrants | Spain | 99.4 /100 | #89 | Exceptional 5.2% |
| Immigrants | Kuwait | 99.4 /100 | #90 | Exceptional 5.3% |
| Mongolians | 99.2 /100 | #91 | Exceptional 5.3% |
| Luxembourgers | 99.2 /100 | #92 | Exceptional 5.3% |
| Immigrants | Peru | 99.1 /100 | #93 | Exceptional 5.3% |
| Immigrants | Jordan | 99.1 /100 | #94 | Exceptional 5.3% |
| Immigrants | Grenada | 99.1 /100 | #95 | Exceptional 5.3% |
| Immigrants | El Salvador | 99.0 /100 | #96 | Exceptional 5.3% |
| Immigrants | Europe | 99.0 /100 | #97 | Exceptional 5.3% |
| Immigrants | Austria | 98.9 /100 | #98 | Exceptional 5.3% |
| Cambodians | 98.8 /100 | #99 | Exceptional 5.3% |
Demographics Similar to Immigrants from Venezuela by Disability Age 5 to 17
In terms of disability age 5 to 17, the demographic groups most similar to Immigrants from Venezuela are Romanian (5.4%, a difference of 0.090%), Latvian (5.4%, a difference of 0.11%), Immigrants from Bulgaria (5.4%, a difference of 0.11%), New Zealander (5.4%, a difference of 0.12%), and Immigrants from Chile (5.4%, a difference of 0.13%).
| Demographics | Rating | Rank | Disability Age 5 to 17 |
| Maltese | 96.0 /100 | #121 | Exceptional 5.4% |
| Chileans | 95.8 /100 | #122 | Exceptional 5.4% |
| Immigrants | Ethiopia | 95.5 /100 | #123 | Exceptional 5.4% |
| Crow | 95.0 /100 | #124 | Exceptional 5.4% |
| Immigrants | Chile | 95.0 /100 | #125 | Exceptional 5.4% |
| New Zealanders | 95.0 /100 | #126 | Exceptional 5.4% |
| Latvians | 95.0 /100 | #127 | Exceptional 5.4% |
| Immigrants | Venezuela | 94.5 /100 | #128 | Exceptional 5.4% |
| Romanians | 94.1 /100 | #129 | Exceptional 5.4% |
| Immigrants | Bulgaria | 94.0 /100 | #130 | Exceptional 5.4% |
| Arabs | 92.9 /100 | #131 | Exceptional 5.4% |
| Immigrants | Colombia | 92.9 /100 | #132 | Exceptional 5.4% |
| Venezuelans | 92.7 /100 | #133 | Exceptional 5.4% |
| Yuman | 92.3 /100 | #134 | Exceptional 5.4% |
| Immigrants | Belize | 91.7 /100 | #135 | Exceptional 5.4% |