Immigrants from Iran vs Ghanaian Ambulatory Disability
COMPARE
Immigrants from Iran
Ghanaian
Ambulatory Disability
Ambulatory Disability Comparison
Immigrants from Iran
Ghanaians
5.4%
AMBULATORY DISABILITY
100.0/ 100
METRIC RATING
29th/ 347
METRIC RANK
6.0%
AMBULATORY DISABILITY
71.3/ 100
METRIC RATING
157th/ 347
METRIC RANK
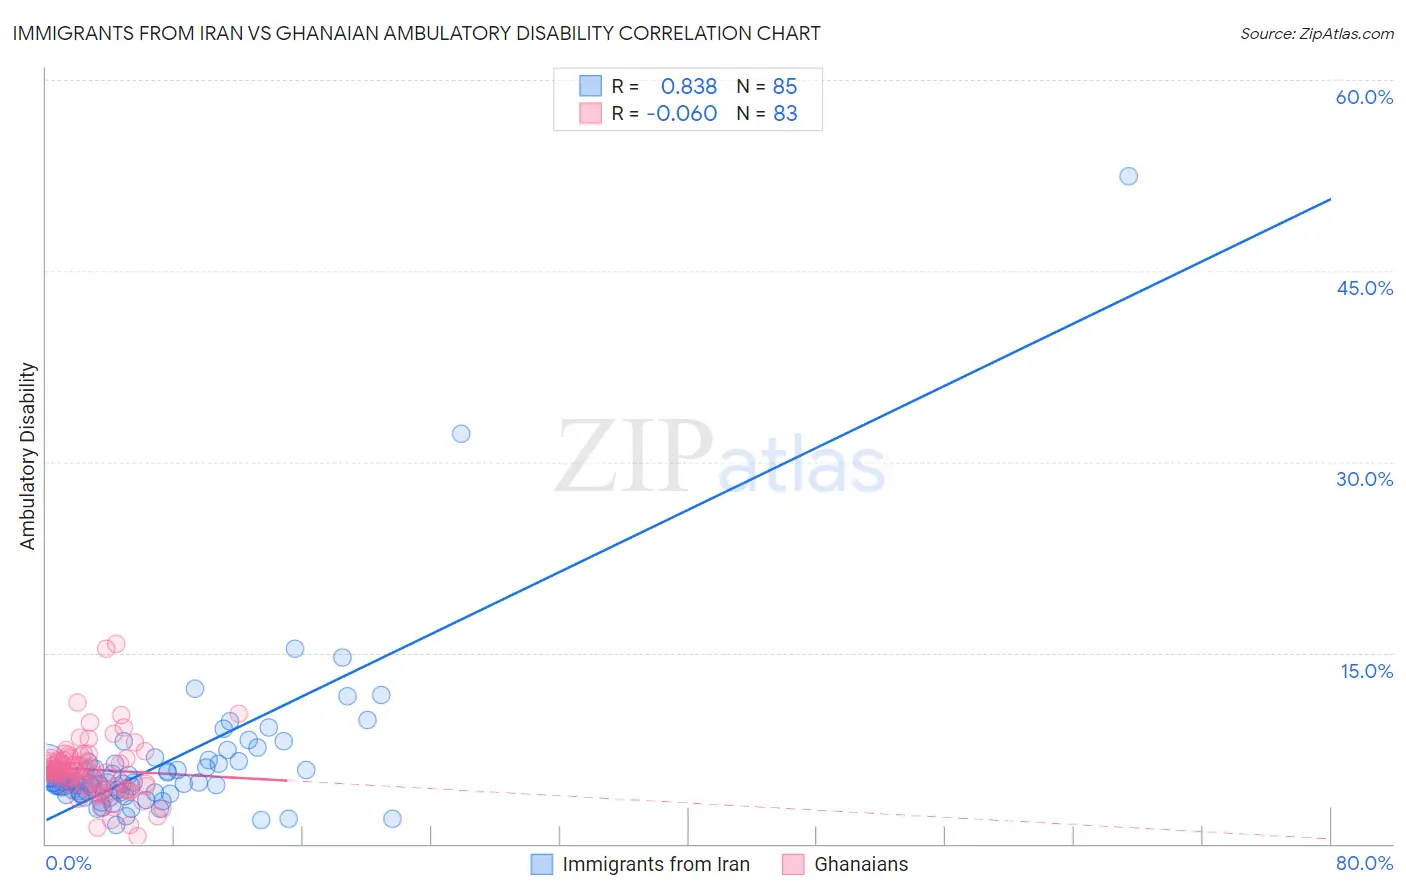
Immigrants from Iran vs Ghanaian Ambulatory Disability Correlation Chart
The statistical analysis conducted on geographies consisting of 279,879,747 people shows a very strong positive correlation between the proportion of Immigrants from Iran and percentage of population with ambulatory disability in the United States with a correlation coefficient (R) of 0.838 and weighted average of 5.4%. Similarly, the statistical analysis conducted on geographies consisting of 190,643,390 people shows a slight negative correlation between the proportion of Ghanaians and percentage of population with ambulatory disability in the United States with a correlation coefficient (R) of -0.060 and weighted average of 6.0%, a difference of 11.7%.
Ambulatory Disability Correlation Summary
| Measurement | Immigrants from Iran | Ghanaian |
| Minimum | 1.5% | 0.61% |
| Maximum | 52.5% | 15.7% |
| Range | 51.0% | 15.1% |
| Mean | 6.3% | 5.8% |
| Median | 4.8% | 5.7% |
| Interquartile 25% (IQ1) | 4.0% | 4.5% |
| Interquartile 75% (IQ3) | 6.3% | 6.6% |
| Interquartile Range (IQR) | 2.3% | 2.1% |
| Standard Deviation (Sample) | 6.4% | 2.5% |
| Standard Deviation (Population) | 6.3% | 2.4% |
Similar Demographics by Ambulatory Disability
Demographics Similar to Immigrants from Iran by Ambulatory Disability
In terms of ambulatory disability, the demographic groups most similar to Immigrants from Iran are Cambodian (5.4%, a difference of 0.10%), Asian (5.4%, a difference of 0.16%), Immigrants from Nepal (5.4%, a difference of 0.32%), Zimbabwean (5.4%, a difference of 0.35%), and Immigrants from Saudi Arabia (5.4%, a difference of 0.43%).
| Demographics | Rating | Rank | Ambulatory Disability |
| Immigrants | Israel | 100.0 /100 | #22 | Exceptional 5.4% |
| Tongans | 100.0 /100 | #23 | Exceptional 5.4% |
| Immigrants | Saudi Arabia | 100.0 /100 | #24 | Exceptional 5.4% |
| Zimbabweans | 100.0 /100 | #25 | Exceptional 5.4% |
| Immigrants | Nepal | 100.0 /100 | #26 | Exceptional 5.4% |
| Asians | 100.0 /100 | #27 | Exceptional 5.4% |
| Cambodians | 100.0 /100 | #28 | Exceptional 5.4% |
| Immigrants | Iran | 100.0 /100 | #29 | Exceptional 5.4% |
| Immigrants | Turkey | 100.0 /100 | #30 | Exceptional 5.4% |
| Immigrants | Venezuela | 100.0 /100 | #31 | Exceptional 5.4% |
| Immigrants | Australia | 100.0 /100 | #32 | Exceptional 5.5% |
| Immigrants | Pakistan | 100.0 /100 | #33 | Exceptional 5.5% |
| Immigrants | Asia | 100.0 /100 | #34 | Exceptional 5.5% |
| Afghans | 100.0 /100 | #35 | Exceptional 5.5% |
| Immigrants | Malaysia | 100.0 /100 | #36 | Exceptional 5.5% |
Demographics Similar to Ghanaians by Ambulatory Disability
In terms of ambulatory disability, the demographic groups most similar to Ghanaians are Immigrants from Fiji (6.0%, a difference of 0.010%), Immigrants from Latvia (6.0%, a difference of 0.020%), Northern European (6.0%, a difference of 0.030%), Immigrants from Scotland (6.0%, a difference of 0.050%), and Central American (6.0%, a difference of 0.10%).
| Demographics | Rating | Rank | Ambulatory Disability |
| Maltese | 81.6 /100 | #150 | Excellent 6.0% |
| Greeks | 79.6 /100 | #151 | Good 6.0% |
| Immigrants | Austria | 78.8 /100 | #152 | Good 6.0% |
| Syrians | 75.5 /100 | #153 | Good 6.0% |
| Immigrants | Croatia | 75.1 /100 | #154 | Good 6.0% |
| Immigrants | Scotland | 72.1 /100 | #155 | Good 6.0% |
| Northern Europeans | 71.8 /100 | #156 | Good 6.0% |
| Ghanaians | 71.3 /100 | #157 | Good 6.0% |
| Immigrants | Fiji | 71.2 /100 | #158 | Good 6.0% |
| Immigrants | Latvia | 71.1 /100 | #159 | Good 6.0% |
| Central Americans | 69.8 /100 | #160 | Good 6.0% |
| Immigrants | Belarus | 69.2 /100 | #161 | Good 6.1% |
| Nigerians | 67.1 /100 | #162 | Good 6.1% |
| Lebanese | 66.2 /100 | #163 | Good 6.1% |
| Basques | 63.7 /100 | #164 | Good 6.1% |