Immigrants from Iran vs Ghanaian Unemployment Among Seniors over 65 years
COMPARE
Immigrants from Iran
Ghanaian
Unemployment Among Seniors over 65 years
Unemployment Among Seniors over 65 years Comparison
Immigrants from Iran
Ghanaians
5.2%
UNEMPLOYMENT AMONG SENIORS OVER 65 YEARS
36.0/ 100
METRIC RATING
185th/ 347
METRIC RANK
5.4%
UNEMPLOYMENT AMONG SENIORS OVER 65 YEARS
0.6/ 100
METRIC RATING
250th/ 347
METRIC RANK
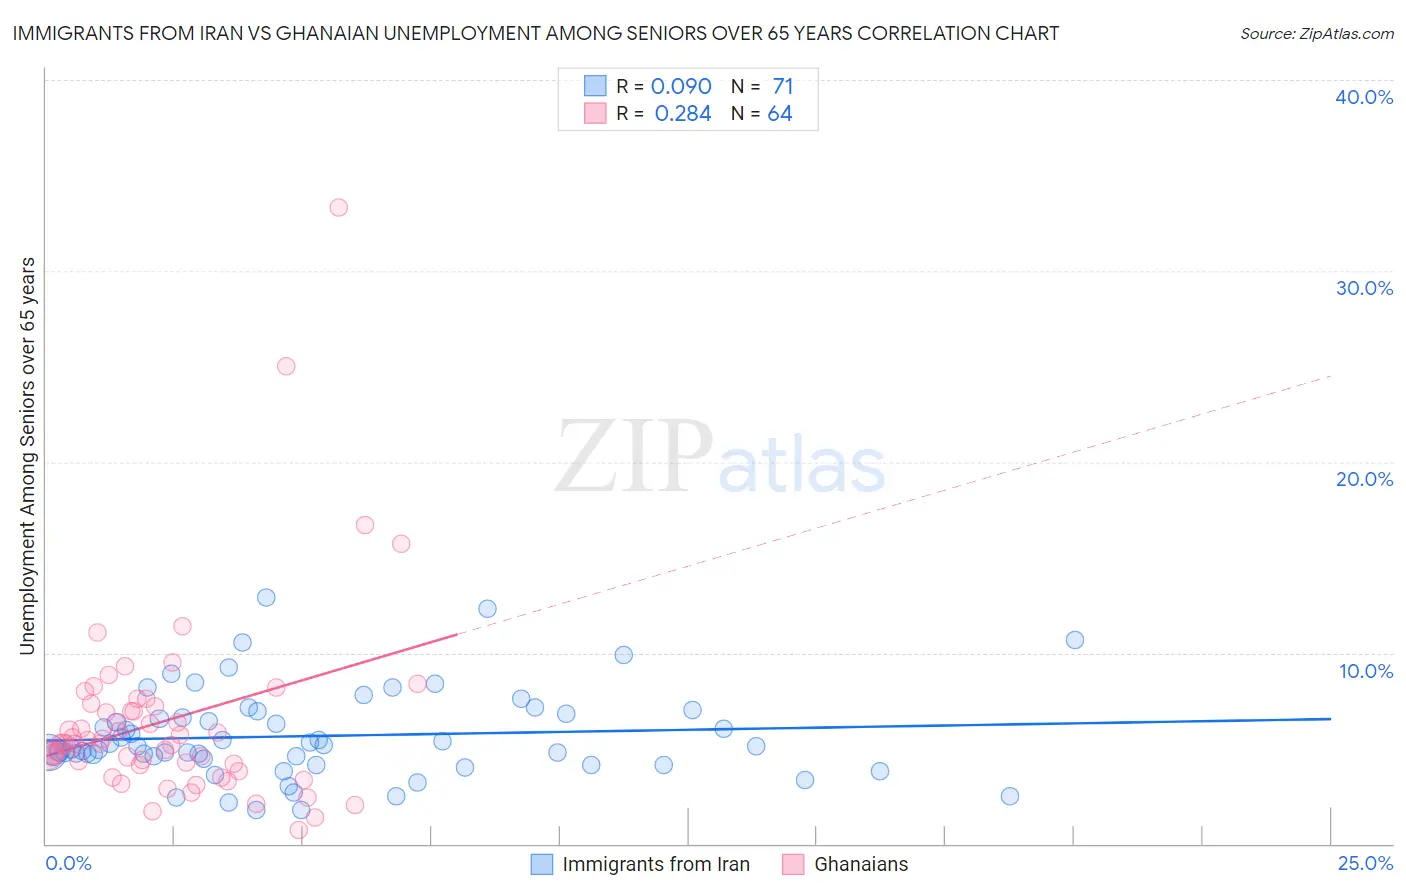
Immigrants from Iran vs Ghanaian Unemployment Among Seniors over 65 years Correlation Chart
The statistical analysis conducted on geographies consisting of 264,234,718 people shows a slight positive correlation between the proportion of Immigrants from Iran and unemployment rate amomg seniors over the age of 65 in the United States with a correlation coefficient (R) of 0.090 and weighted average of 5.2%. Similarly, the statistical analysis conducted on geographies consisting of 181,103,257 people shows a weak positive correlation between the proportion of Ghanaians and unemployment rate amomg seniors over the age of 65 in the United States with a correlation coefficient (R) of 0.284 and weighted average of 5.4%, a difference of 3.6%.
Unemployment Among Seniors over 65 years Correlation Summary
| Measurement | Immigrants from Iran | Ghanaian |
| Minimum | 1.8% | 0.70% |
| Maximum | 12.9% | 33.3% |
| Range | 11.1% | 32.6% |
| Mean | 5.6% | 6.5% |
| Median | 5.1% | 5.2% |
| Interquartile 25% (IQ1) | 4.4% | 4.2% |
| Interquartile 75% (IQ3) | 6.8% | 7.3% |
| Interquartile Range (IQR) | 2.4% | 3.1% |
| Standard Deviation (Sample) | 2.3% | 5.1% |
| Standard Deviation (Population) | 2.3% | 5.0% |
Similar Demographics by Unemployment Among Seniors over 65 years
Demographics Similar to Immigrants from Iran by Unemployment Among Seniors over 65 years
In terms of unemployment among seniors over 65 years, the demographic groups most similar to Immigrants from Iran are American (5.2%, a difference of 0.030%), Somali (5.2%, a difference of 0.090%), Immigrants from Egypt (5.2%, a difference of 0.10%), Bangladeshi (5.2%, a difference of 0.13%), and Korean (5.2%, a difference of 0.16%).
| Demographics | Rating | Rank | Unemployment Among Seniors over 65 years |
| Immigrants | Belgium | 44.8 /100 | #178 | Average 5.2% |
| Immigrants | Somalia | 44.0 /100 | #179 | Average 5.2% |
| Russians | 43.6 /100 | #180 | Average 5.2% |
| Immigrants | Italy | 43.5 /100 | #181 | Average 5.2% |
| Panamanians | 43.0 /100 | #182 | Average 5.2% |
| Immigrants | Western Asia | 42.1 /100 | #183 | Average 5.2% |
| Immigrants | Serbia | 41.6 /100 | #184 | Average 5.2% |
| Immigrants | Iran | 36.0 /100 | #185 | Fair 5.2% |
| Americans | 35.1 /100 | #186 | Fair 5.2% |
| Somalis | 33.5 /100 | #187 | Fair 5.2% |
| Immigrants | Egypt | 33.2 /100 | #188 | Fair 5.2% |
| Bangladeshis | 32.3 /100 | #189 | Fair 5.2% |
| Koreans | 31.6 /100 | #190 | Fair 5.2% |
| Immigrants | Denmark | 31.0 /100 | #191 | Fair 5.2% |
| Sioux | 30.8 /100 | #192 | Fair 5.2% |
Demographics Similar to Ghanaians by Unemployment Among Seniors over 65 years
In terms of unemployment among seniors over 65 years, the demographic groups most similar to Ghanaians are Immigrants (5.4%, a difference of 0.0%), West Indian (5.4%, a difference of 0.010%), French Canadian (5.4%, a difference of 0.030%), Immigrants from Caribbean (5.3%, a difference of 0.080%), and Trinidadian and Tobagonian (5.4%, a difference of 0.080%).
| Demographics | Rating | Rank | Unemployment Among Seniors over 65 years |
| Nigerians | 0.9 /100 | #243 | Tragic 5.3% |
| Peruvians | 0.8 /100 | #244 | Tragic 5.3% |
| Ottawa | 0.8 /100 | #245 | Tragic 5.3% |
| Colombians | 0.7 /100 | #246 | Tragic 5.3% |
| Immigrants | Caribbean | 0.7 /100 | #247 | Tragic 5.3% |
| French Canadians | 0.7 /100 | #248 | Tragic 5.4% |
| Immigrants | Immigrants | 0.6 /100 | #249 | Tragic 5.4% |
| Ghanaians | 0.6 /100 | #250 | Tragic 5.4% |
| West Indians | 0.6 /100 | #251 | Tragic 5.4% |
| Trinidadians and Tobagonians | 0.6 /100 | #252 | Tragic 5.4% |
| Immigrants | Sierra Leone | 0.6 /100 | #253 | Tragic 5.4% |
| Paraguayans | 0.5 /100 | #254 | Tragic 5.4% |
| Immigrants | Peru | 0.5 /100 | #255 | Tragic 5.4% |
| Moroccans | 0.5 /100 | #256 | Tragic 5.4% |
| Immigrants | Micronesia | 0.4 /100 | #257 | Tragic 5.4% |