Immigrants from Iran vs Immigrants from Yemen Ambulatory Disability
COMPARE
Immigrants from Iran
Immigrants from Yemen
Ambulatory Disability
Ambulatory Disability Comparison
Immigrants from Iran
Immigrants from Yemen
5.4%
AMBULATORY DISABILITY
100.0/ 100
METRIC RATING
29th/ 347
METRIC RANK
7.1%
AMBULATORY DISABILITY
0.0/ 100
METRIC RATING
313th/ 347
METRIC RANK
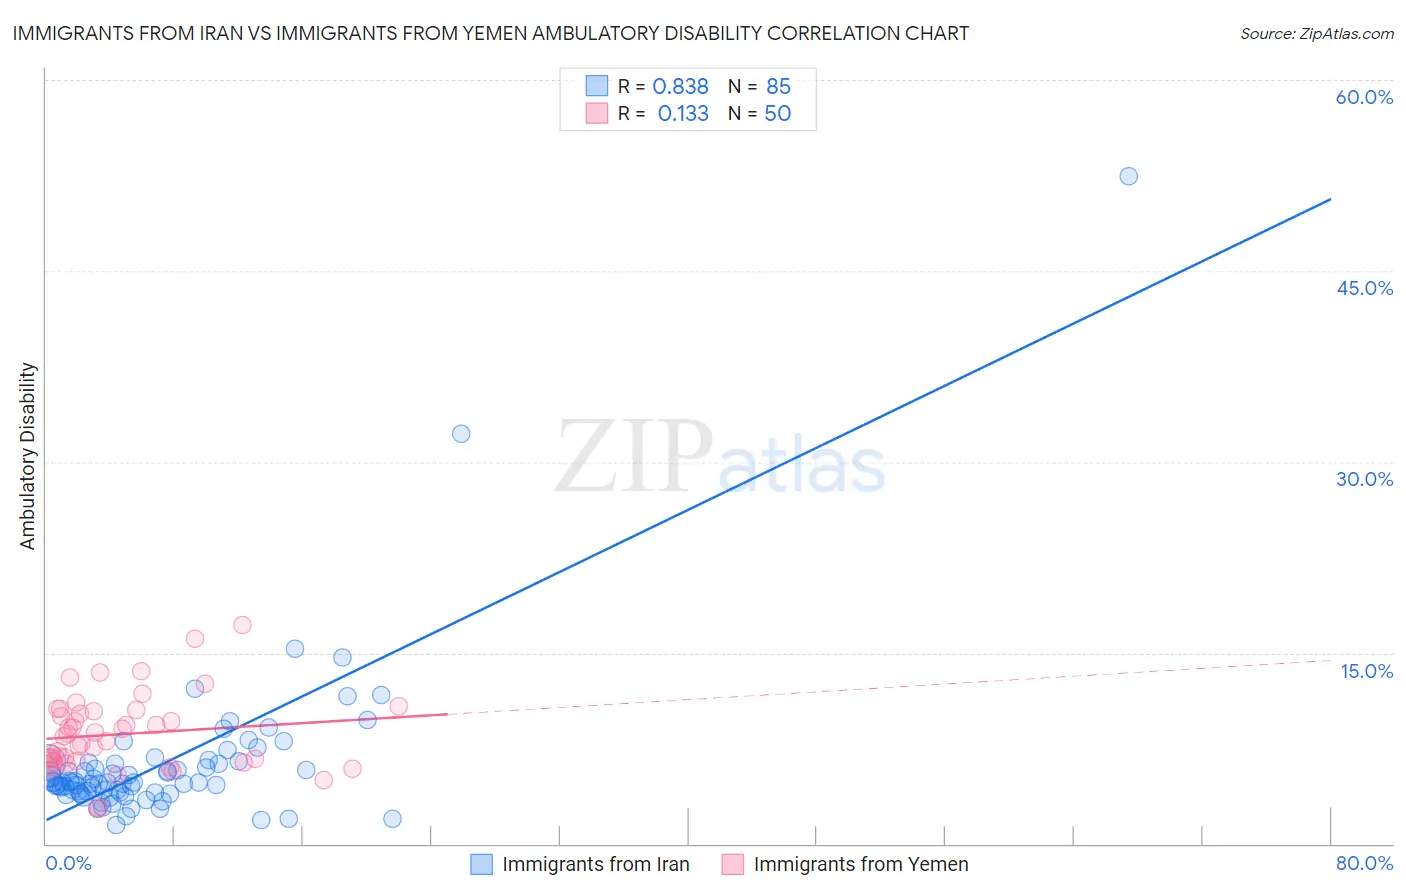
Immigrants from Iran vs Immigrants from Yemen Ambulatory Disability Correlation Chart
The statistical analysis conducted on geographies consisting of 279,879,747 people shows a very strong positive correlation between the proportion of Immigrants from Iran and percentage of population with ambulatory disability in the United States with a correlation coefficient (R) of 0.838 and weighted average of 5.4%. Similarly, the statistical analysis conducted on geographies consisting of 82,432,015 people shows a poor positive correlation between the proportion of Immigrants from Yemen and percentage of population with ambulatory disability in the United States with a correlation coefficient (R) of 0.133 and weighted average of 7.1%, a difference of 31.7%.
Ambulatory Disability Correlation Summary
| Measurement | Immigrants from Iran | Immigrants from Yemen |
| Minimum | 1.5% | 2.8% |
| Maximum | 52.5% | 17.1% |
| Range | 51.0% | 14.4% |
| Mean | 6.3% | 8.6% |
| Median | 4.8% | 8.3% |
| Interquartile 25% (IQ1) | 4.0% | 6.4% |
| Interquartile 75% (IQ3) | 6.3% | 10.4% |
| Interquartile Range (IQR) | 2.3% | 4.0% |
| Standard Deviation (Sample) | 6.4% | 3.0% |
| Standard Deviation (Population) | 6.3% | 2.9% |
Similar Demographics by Ambulatory Disability
Demographics Similar to Immigrants from Iran by Ambulatory Disability
In terms of ambulatory disability, the demographic groups most similar to Immigrants from Iran are Cambodian (5.4%, a difference of 0.10%), Asian (5.4%, a difference of 0.16%), Immigrants from Nepal (5.4%, a difference of 0.32%), Zimbabwean (5.4%, a difference of 0.35%), and Immigrants from Saudi Arabia (5.4%, a difference of 0.43%).
| Demographics | Rating | Rank | Ambulatory Disability |
| Immigrants | Israel | 100.0 /100 | #22 | Exceptional 5.4% |
| Tongans | 100.0 /100 | #23 | Exceptional 5.4% |
| Immigrants | Saudi Arabia | 100.0 /100 | #24 | Exceptional 5.4% |
| Zimbabweans | 100.0 /100 | #25 | Exceptional 5.4% |
| Immigrants | Nepal | 100.0 /100 | #26 | Exceptional 5.4% |
| Asians | 100.0 /100 | #27 | Exceptional 5.4% |
| Cambodians | 100.0 /100 | #28 | Exceptional 5.4% |
| Immigrants | Iran | 100.0 /100 | #29 | Exceptional 5.4% |
| Immigrants | Turkey | 100.0 /100 | #30 | Exceptional 5.4% |
| Immigrants | Venezuela | 100.0 /100 | #31 | Exceptional 5.4% |
| Immigrants | Australia | 100.0 /100 | #32 | Exceptional 5.5% |
| Immigrants | Pakistan | 100.0 /100 | #33 | Exceptional 5.5% |
| Immigrants | Asia | 100.0 /100 | #34 | Exceptional 5.5% |
| Afghans | 100.0 /100 | #35 | Exceptional 5.5% |
| Immigrants | Malaysia | 100.0 /100 | #36 | Exceptional 5.5% |
Demographics Similar to Immigrants from Yemen by Ambulatory Disability
In terms of ambulatory disability, the demographic groups most similar to Immigrants from Yemen are Blackfeet (7.1%, a difference of 0.020%), Shoshone (7.1%, a difference of 0.040%), Delaware (7.1%, a difference of 0.13%), Immigrants from Dominican Republic (7.1%, a difference of 0.28%), and Cree (7.1%, a difference of 0.35%).
| Demographics | Rating | Rank | Ambulatory Disability |
| Iroquois | 0.0 /100 | #306 | Tragic 7.1% |
| Spanish Americans | 0.0 /100 | #307 | Tragic 7.1% |
| Chippewa | 0.0 /100 | #308 | Tragic 7.1% |
| Immigrants | Azores | 0.0 /100 | #309 | Tragic 7.1% |
| Arapaho | 0.0 /100 | #310 | Tragic 7.1% |
| Cree | 0.0 /100 | #311 | Tragic 7.1% |
| Delaware | 0.0 /100 | #312 | Tragic 7.1% |
| Immigrants | Yemen | 0.0 /100 | #313 | Tragic 7.1% |
| Blackfeet | 0.0 /100 | #314 | Tragic 7.1% |
| Shoshone | 0.0 /100 | #315 | Tragic 7.1% |
| Immigrants | Dominican Republic | 0.0 /100 | #316 | Tragic 7.1% |
| Central American Indians | 0.0 /100 | #317 | Tragic 7.2% |
| Ottawa | 0.0 /100 | #318 | Tragic 7.2% |
| Dominicans | 0.0 /100 | #319 | Tragic 7.2% |
| Potawatomi | 0.0 /100 | #320 | Tragic 7.3% |