Immigrants from Iran vs Ghanaian Single Male Poverty
COMPARE
Immigrants from Iran
Ghanaian
Single Male Poverty
Single Male Poverty Comparison
Immigrants from Iran
Ghanaians
11.4%
SINGLE MALE POVERTY
100.0/ 100
METRIC RATING
31st/ 347
METRIC RANK
13.3%
SINGLE MALE POVERTY
6.1/ 100
METRIC RATING
230th/ 347
METRIC RANK
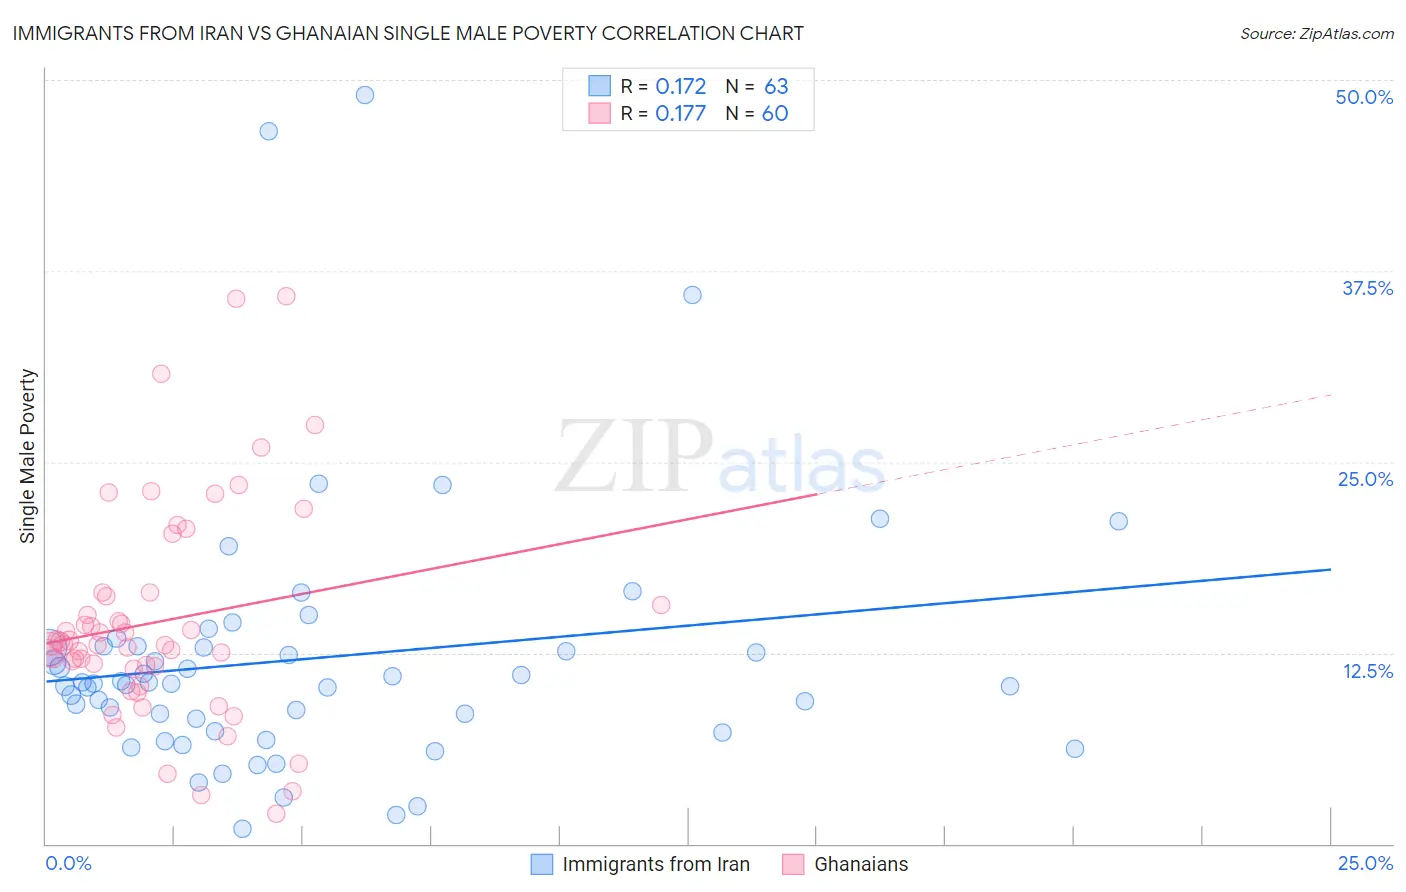
Immigrants from Iran vs Ghanaian Single Male Poverty Correlation Chart
The statistical analysis conducted on geographies consisting of 253,206,920 people shows a poor positive correlation between the proportion of Immigrants from Iran and poverty level among single males in the United States with a correlation coefficient (R) of 0.172 and weighted average of 11.4%. Similarly, the statistical analysis conducted on geographies consisting of 177,869,684 people shows a poor positive correlation between the proportion of Ghanaians and poverty level among single males in the United States with a correlation coefficient (R) of 0.177 and weighted average of 13.3%, a difference of 16.2%.
Single Male Poverty Correlation Summary
| Measurement | Immigrants from Iran | Ghanaian |
| Minimum | 0.97% | 2.0% |
| Maximum | 49.0% | 35.8% |
| Range | 48.0% | 33.9% |
| Mean | 12.1% | 14.5% |
| Median | 10.5% | 13.1% |
| Interquartile 25% (IQ1) | 7.4% | 11.5% |
| Interquartile 75% (IQ3) | 12.9% | 16.3% |
| Interquartile Range (IQR) | 5.6% | 4.8% |
| Standard Deviation (Sample) | 8.7% | 7.0% |
| Standard Deviation (Population) | 8.6% | 7.0% |
Similar Demographics by Single Male Poverty
Demographics Similar to Immigrants from Iran by Single Male Poverty
In terms of single male poverty, the demographic groups most similar to Immigrants from Iran are Iranian (11.4%, a difference of 0.090%), Immigrants from Eastern Asia (11.4%, a difference of 0.090%), Immigrants from Egypt (11.4%, a difference of 0.15%), Immigrants from Vietnam (11.4%, a difference of 0.16%), and Immigrants from Ethiopia (11.4%, a difference of 0.20%).
| Demographics | Rating | Rank | Single Male Poverty |
| Indians (Asian) | 100.0 /100 | #24 | Exceptional 11.3% |
| Maltese | 100.0 /100 | #25 | Exceptional 11.3% |
| Immigrants | Japan | 100.0 /100 | #26 | Exceptional 11.3% |
| Immigrants | China | 100.0 /100 | #27 | Exceptional 11.4% |
| Immigrants | Asia | 100.0 /100 | #28 | Exceptional 11.4% |
| Immigrants | Egypt | 100.0 /100 | #29 | Exceptional 11.4% |
| Iranians | 100.0 /100 | #30 | Exceptional 11.4% |
| Immigrants | Iran | 100.0 /100 | #31 | Exceptional 11.4% |
| Immigrants | Eastern Asia | 100.0 /100 | #32 | Exceptional 11.4% |
| Immigrants | Vietnam | 100.0 /100 | #33 | Exceptional 11.4% |
| Immigrants | Ethiopia | 100.0 /100 | #34 | Exceptional 11.4% |
| Immigrants | South Eastern Asia | 100.0 /100 | #35 | Exceptional 11.4% |
| Immigrants | Serbia | 100.0 /100 | #36 | Exceptional 11.4% |
| Immigrants | Singapore | 100.0 /100 | #37 | Exceptional 11.4% |
| Sri Lankans | 100.0 /100 | #38 | Exceptional 11.5% |
Demographics Similar to Ghanaians by Single Male Poverty
In terms of single male poverty, the demographic groups most similar to Ghanaians are European (13.3%, a difference of 0.030%), Lebanese (13.2%, a difference of 0.12%), Slavic (13.3%, a difference of 0.18%), Haitian (13.2%, a difference of 0.20%), and Immigrants from Caribbean (13.3%, a difference of 0.27%).
| Demographics | Rating | Rank | Single Male Poverty |
| Immigrants | Azores | 9.3 /100 | #223 | Tragic 13.2% |
| Somalis | 9.1 /100 | #224 | Tragic 13.2% |
| Immigrants | Denmark | 8.7 /100 | #225 | Tragic 13.2% |
| Jamaicans | 7.7 /100 | #226 | Tragic 13.2% |
| Haitians | 7.0 /100 | #227 | Tragic 13.2% |
| Lebanese | 6.6 /100 | #228 | Tragic 13.2% |
| Europeans | 6.2 /100 | #229 | Tragic 13.3% |
| Ghanaians | 6.1 /100 | #230 | Tragic 13.3% |
| Slavs | 5.3 /100 | #231 | Tragic 13.3% |
| Immigrants | Caribbean | 5.0 /100 | #232 | Tragic 13.3% |
| British | 4.0 /100 | #233 | Tragic 13.3% |
| Canadians | 4.0 /100 | #234 | Tragic 13.3% |
| Bangladeshis | 3.7 /100 | #235 | Tragic 13.3% |
| Luxembourgers | 3.6 /100 | #236 | Tragic 13.4% |
| British West Indians | 3.4 /100 | #237 | Tragic 13.4% |