Immigrants from Indonesia vs Bhutanese Self-Care Disability
COMPARE
Immigrants from Indonesia
Bhutanese
Self-Care Disability
Self-Care Disability Comparison
Immigrants from Indonesia
Bhutanese
2.4%
SELF-CARE DISABILITY
94.3/ 100
METRIC RATING
106th/ 347
METRIC RANK
2.4%
SELF-CARE DISABILITY
94.5/ 100
METRIC RATING
104th/ 347
METRIC RANK
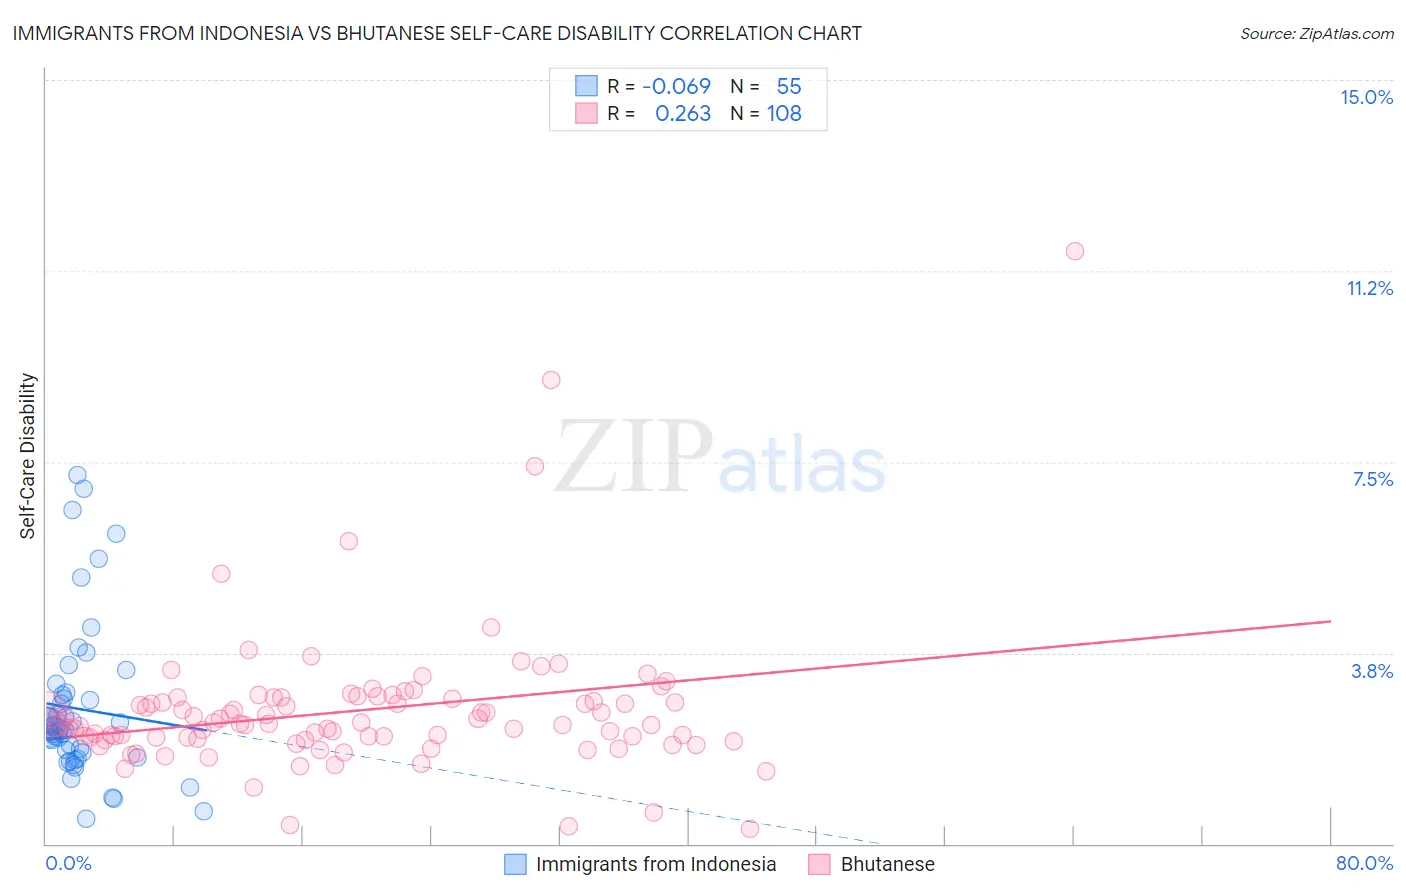
Immigrants from Indonesia vs Bhutanese Self-Care Disability Correlation Chart
The statistical analysis conducted on geographies consisting of 215,649,762 people shows a slight negative correlation between the proportion of Immigrants from Indonesia and percentage of population with self-care disability in the United States with a correlation coefficient (R) of -0.069 and weighted average of 2.4%. Similarly, the statistical analysis conducted on geographies consisting of 454,630,496 people shows a weak positive correlation between the proportion of Bhutanese and percentage of population with self-care disability in the United States with a correlation coefficient (R) of 0.263 and weighted average of 2.4%, a difference of 0.040%.
Self-Care Disability Correlation Summary
| Measurement | Immigrants from Indonesia | Bhutanese |
| Minimum | 0.49% | 0.28% |
| Maximum | 7.2% | 11.6% |
| Range | 6.8% | 11.4% |
| Mean | 2.7% | 2.6% |
| Median | 2.3% | 2.4% |
| Interquartile 25% (IQ1) | 1.8% | 2.1% |
| Interquartile 75% (IQ3) | 2.9% | 2.9% |
| Interquartile Range (IQR) | 1.1% | 0.78% |
| Standard Deviation (Sample) | 1.5% | 1.4% |
| Standard Deviation (Population) | 1.5% | 1.4% |
Demographics Similar to Immigrants from Indonesia and Bhutanese by Self-Care Disability
In terms of self-care disability, the demographic groups most similar to Immigrants from Indonesia are Carpatho Rusyn (2.4%, a difference of 0.010%), British (2.4%, a difference of 0.010%), Greek (2.4%, a difference of 0.040%), Slovene (2.4%, a difference of 0.050%), and Immigrants from Africa (2.4%, a difference of 0.13%). Similarly, the demographic groups most similar to Bhutanese are Carpatho Rusyn (2.4%, a difference of 0.030%), British (2.4%, a difference of 0.050%), Greek (2.4%, a difference of 0.080%), Slovene (2.4%, a difference of 0.090%), and Alsatian (2.4%, a difference of 0.10%).
| Demographics | Rating | Rank | Self-Care Disability |
| Immigrants | Asia | 96.9 /100 | #95 | Exceptional 2.4% |
| Immigrants | Chile | 96.7 /100 | #96 | Exceptional 2.4% |
| Swiss | 96.6 /100 | #97 | Exceptional 2.4% |
| Immigrants | Poland | 96.4 /100 | #98 | Exceptional 2.4% |
| Immigrants | Israel | 96.1 /100 | #99 | Exceptional 2.4% |
| Europeans | 95.8 /100 | #100 | Exceptional 2.4% |
| Immigrants | Scotland | 95.7 /100 | #101 | Exceptional 2.4% |
| Croatians | 95.0 /100 | #102 | Exceptional 2.4% |
| Alsatians | 94.9 /100 | #103 | Exceptional 2.4% |
| Bhutanese | 94.5 /100 | #104 | Exceptional 2.4% |
| Carpatho Rusyns | 94.4 /100 | #105 | Exceptional 2.4% |
| Immigrants | Indonesia | 94.3 /100 | #106 | Exceptional 2.4% |
| British | 94.3 /100 | #107 | Exceptional 2.4% |
| Greeks | 94.1 /100 | #108 | Exceptional 2.4% |
| Slovenes | 94.1 /100 | #109 | Exceptional 2.4% |
| Immigrants | Africa | 93.7 /100 | #110 | Exceptional 2.4% |
| Serbians | 93.6 /100 | #111 | Exceptional 2.4% |
| Scandinavians | 93.5 /100 | #112 | Exceptional 2.4% |
| South Americans | 93.2 /100 | #113 | Exceptional 2.4% |
| Immigrants | North Macedonia | 93.1 /100 | #114 | Exceptional 2.4% |
| Immigrants | Hong Kong | 93.1 /100 | #115 | Exceptional 2.4% |