Immigrants from India vs Immigrants from Afghanistan Disability
COMPARE
Immigrants from India
Immigrants from Afghanistan
Disability
Disability Comparison
Immigrants from India
Immigrants from Afghanistan
9.5%
DISABILITY
100.0/ 100
METRIC RATING
1st/ 347
METRIC RANK
11.0%
DISABILITY
99.6/ 100
METRIC RATING
68th/ 347
METRIC RANK
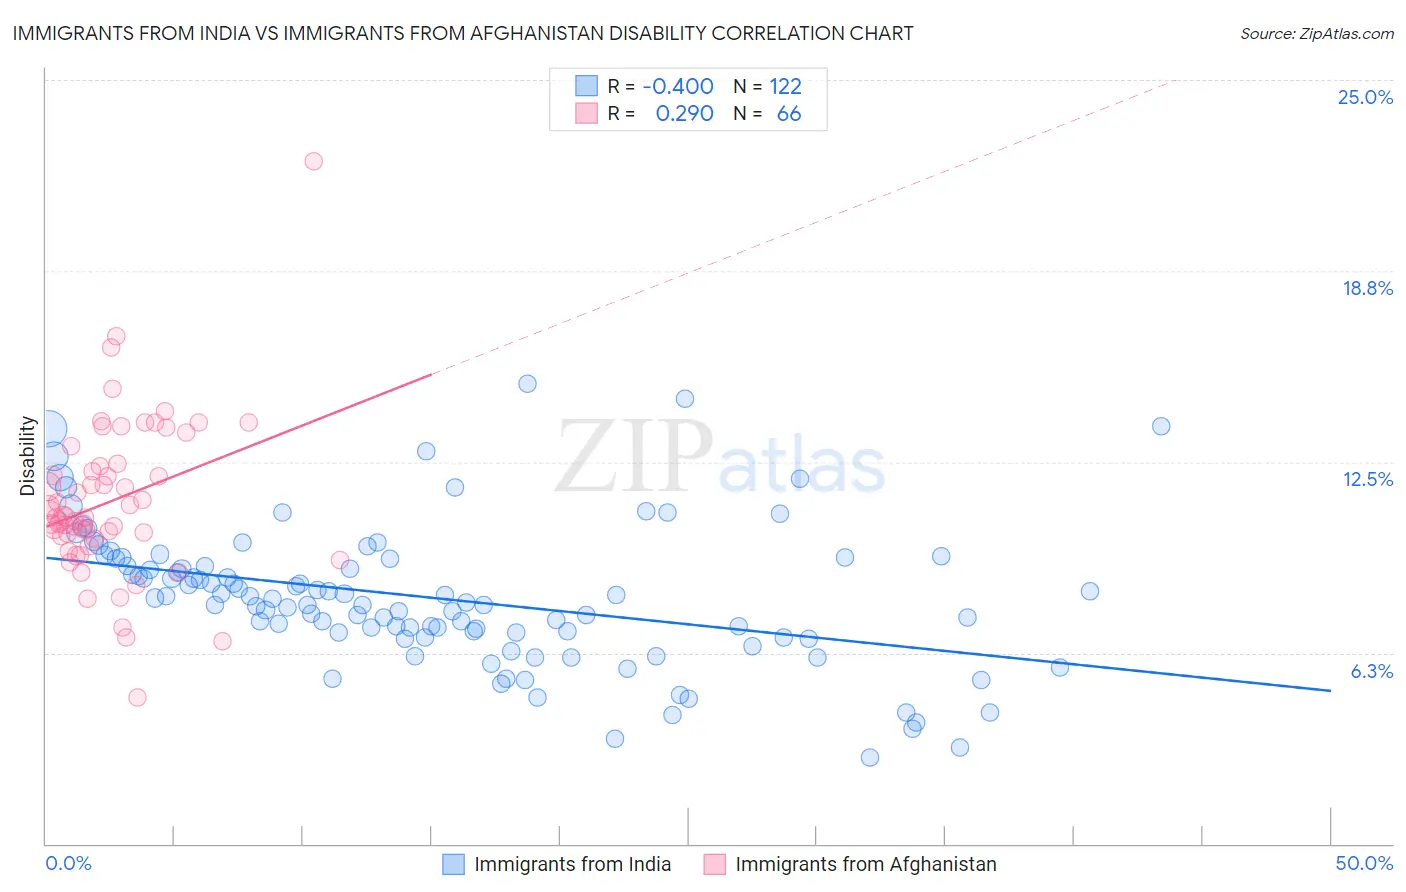
Immigrants from India vs Immigrants from Afghanistan Disability Correlation Chart
The statistical analysis conducted on geographies consisting of 434,094,669 people shows a mild negative correlation between the proportion of Immigrants from India and percentage of population with a disability in the United States with a correlation coefficient (R) of -0.400 and weighted average of 9.5%. Similarly, the statistical analysis conducted on geographies consisting of 147,638,051 people shows a weak positive correlation between the proportion of Immigrants from Afghanistan and percentage of population with a disability in the United States with a correlation coefficient (R) of 0.290 and weighted average of 11.0%, a difference of 15.7%.
Disability Correlation Summary
| Measurement | Immigrants from India | Immigrants from Afghanistan |
| Minimum | 2.8% | 4.8% |
| Maximum | 15.1% | 22.3% |
| Range | 12.2% | 17.5% |
| Mean | 8.1% | 11.2% |
| Median | 7.9% | 10.7% |
| Interquartile 25% (IQ1) | 6.9% | 10.1% |
| Interquartile 75% (IQ3) | 9.3% | 12.3% |
| Interquartile Range (IQR) | 2.4% | 2.3% |
| Standard Deviation (Sample) | 2.3% | 2.6% |
| Standard Deviation (Population) | 2.3% | 2.6% |
Similar Demographics by Disability
Demographics Similar to Immigrants from India by Disability
In terms of disability, the demographic groups most similar to Immigrants from India are Filipino (9.6%, a difference of 0.98%), Immigrants from Taiwan (9.6%, a difference of 1.1%), Thai (9.7%, a difference of 2.1%), Immigrants from Bolivia (9.9%, a difference of 3.8%), and Immigrants from South Central Asia (9.9%, a difference of 4.7%).
| Demographics | Rating | Rank | Disability |
| Immigrants | India | 100.0 /100 | #1 | Exceptional 9.5% |
| Filipinos | 100.0 /100 | #2 | Exceptional 9.6% |
| Immigrants | Taiwan | 100.0 /100 | #3 | Exceptional 9.6% |
| Thais | 100.0 /100 | #4 | Exceptional 9.7% |
| Immigrants | Bolivia | 100.0 /100 | #5 | Exceptional 9.9% |
| Immigrants | South Central Asia | 100.0 /100 | #6 | Exceptional 9.9% |
| Immigrants | Singapore | 100.0 /100 | #7 | Exceptional 10.0% |
| Bolivians | 100.0 /100 | #8 | Exceptional 10.0% |
| Immigrants | Hong Kong | 100.0 /100 | #9 | Exceptional 10.0% |
| Immigrants | China | 100.0 /100 | #10 | Exceptional 10.1% |
| Iranians | 100.0 /100 | #11 | Exceptional 10.1% |
| Immigrants | Israel | 100.0 /100 | #12 | Exceptional 10.1% |
| Immigrants | Eastern Asia | 100.0 /100 | #13 | Exceptional 10.2% |
| Immigrants | Korea | 100.0 /100 | #14 | Exceptional 10.2% |
| Okinawans | 100.0 /100 | #15 | Exceptional 10.3% |
Demographics Similar to Immigrants from Afghanistan by Disability
In terms of disability, the demographic groups most similar to Immigrants from Afghanistan are Colombian (11.0%, a difference of 0.12%), Laotian (11.0%, a difference of 0.20%), Sri Lankan (11.0%, a difference of 0.21%), Bulgarian (11.0%, a difference of 0.22%), and Immigrants from Sweden (11.0%, a difference of 0.24%).
| Demographics | Rating | Rank | Disability |
| Immigrants | Bulgaria | 99.7 /100 | #61 | Exceptional 10.9% |
| Immigrants | Northern Africa | 99.7 /100 | #62 | Exceptional 10.9% |
| Immigrants | Eritrea | 99.7 /100 | #63 | Exceptional 11.0% |
| Immigrants | Sweden | 99.6 /100 | #64 | Exceptional 11.0% |
| Bulgarians | 99.6 /100 | #65 | Exceptional 11.0% |
| Laotians | 99.6 /100 | #66 | Exceptional 11.0% |
| Colombians | 99.6 /100 | #67 | Exceptional 11.0% |
| Immigrants | Afghanistan | 99.6 /100 | #68 | Exceptional 11.0% |
| Sri Lankans | 99.5 /100 | #69 | Exceptional 11.0% |
| Immigrants | France | 99.4 /100 | #70 | Exceptional 11.0% |
| Immigrants | Lebanon | 99.4 /100 | #71 | Exceptional 11.0% |
| Immigrants | Chile | 99.4 /100 | #72 | Exceptional 11.0% |
| Immigrants | Bangladesh | 99.4 /100 | #73 | Exceptional 11.0% |
| Immigrants | Serbia | 99.4 /100 | #74 | Exceptional 11.0% |
| Immigrants | Vietnam | 99.4 /100 | #75 | Exceptional 11.0% |