Immigrants from Hungary vs Estonian Disability
COMPARE
Immigrants from Hungary
Estonian
Disability
Disability Comparison
Immigrants from Hungary
Estonians
11.5%
DISABILITY
79.0/ 100
METRIC RATING
146th/ 347
METRIC RANK
11.7%
DISABILITY
54.4/ 100
METRIC RATING
167th/ 347
METRIC RANK
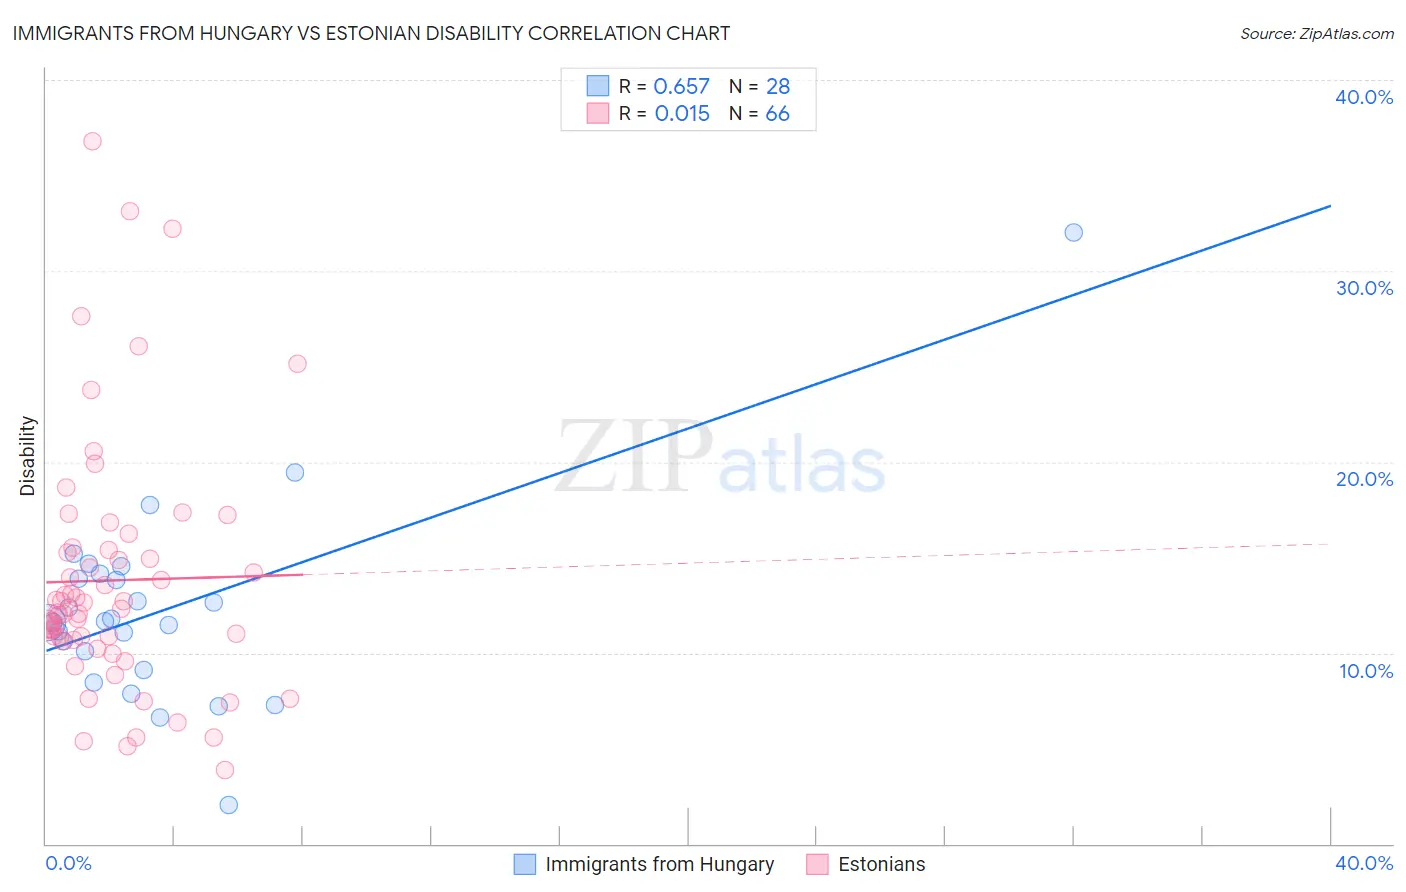
Immigrants from Hungary vs Estonian Disability Correlation Chart
The statistical analysis conducted on geographies consisting of 195,708,395 people shows a significant positive correlation between the proportion of Immigrants from Hungary and percentage of population with a disability in the United States with a correlation coefficient (R) of 0.657 and weighted average of 11.5%. Similarly, the statistical analysis conducted on geographies consisting of 123,527,631 people shows no correlation between the proportion of Estonians and percentage of population with a disability in the United States with a correlation coefficient (R) of 0.015 and weighted average of 11.7%, a difference of 1.3%.
Disability Correlation Summary
| Measurement | Immigrants from Hungary | Estonian |
| Minimum | 2.0% | 3.8% |
| Maximum | 32.0% | 36.8% |
| Range | 30.0% | 33.0% |
| Mean | 12.2% | 13.8% |
| Median | 11.6% | 12.2% |
| Interquartile 25% (IQ1) | 9.6% | 10.7% |
| Interquartile 75% (IQ3) | 14.0% | 15.4% |
| Interquartile Range (IQR) | 4.4% | 4.8% |
| Standard Deviation (Sample) | 5.2% | 6.6% |
| Standard Deviation (Population) | 5.1% | 6.5% |
Similar Demographics by Disability
Demographics Similar to Immigrants from Hungary by Disability
In terms of disability, the demographic groups most similar to Immigrants from Hungary are Immigrants from Ukraine (11.5%, a difference of 0.090%), Sudanese (11.5%, a difference of 0.12%), Nigerian (11.5%, a difference of 0.16%), Australian (11.5%, a difference of 0.25%), and Moroccan (11.5%, a difference of 0.32%).
| Demographics | Rating | Rank | Disability |
| Ghanaians | 87.0 /100 | #139 | Excellent 11.5% |
| Russians | 86.8 /100 | #140 | Excellent 11.5% |
| Immigrants | Grenada | 86.1 /100 | #141 | Excellent 11.5% |
| Immigrants | Sudan | 85.3 /100 | #142 | Excellent 11.5% |
| Moroccans | 83.3 /100 | #143 | Excellent 11.5% |
| Australians | 82.5 /100 | #144 | Excellent 11.5% |
| Nigerians | 81.3 /100 | #145 | Excellent 11.5% |
| Immigrants | Hungary | 79.0 /100 | #146 | Good 11.5% |
| Immigrants | Ukraine | 77.6 /100 | #147 | Good 11.5% |
| Sudanese | 77.1 /100 | #148 | Good 11.5% |
| Immigrants | Norway | 73.2 /100 | #149 | Good 11.6% |
| Romanians | 72.7 /100 | #150 | Good 11.6% |
| Immigrants | Kenya | 72.1 /100 | #151 | Good 11.6% |
| Immigrants | Moldova | 72.0 /100 | #152 | Good 11.6% |
| Immigrants | Ghana | 71.2 /100 | #153 | Good 11.6% |
Demographics Similar to Estonians by Disability
In terms of disability, the demographic groups most similar to Estonians are Pakistani (11.7%, a difference of 0.010%), Immigrants from Latin America (11.7%, a difference of 0.020%), Immigrants from Austria (11.7%, a difference of 0.050%), Immigrants from Albania (11.7%, a difference of 0.070%), and Immigrants from Southern Europe (11.7%, a difference of 0.070%).
| Demographics | Rating | Rank | Disability |
| Immigrants | Barbados | 64.2 /100 | #160 | Good 11.6% |
| Immigrants | Cuba | 62.8 /100 | #161 | Good 11.6% |
| Immigrants | Haiti | 59.2 /100 | #162 | Average 11.7% |
| Immigrants | Trinidad and Tobago | 58.9 /100 | #163 | Average 11.7% |
| Syrians | 58.5 /100 | #164 | Average 11.7% |
| Cubans | 56.7 /100 | #165 | Average 11.7% |
| Pakistanis | 54.7 /100 | #166 | Average 11.7% |
| Estonians | 54.4 /100 | #167 | Average 11.7% |
| Immigrants | Latin America | 54.1 /100 | #168 | Average 11.7% |
| Immigrants | Austria | 53.4 /100 | #169 | Average 11.7% |
| Immigrants | Albania | 52.8 /100 | #170 | Average 11.7% |
| Immigrants | Southern Europe | 52.8 /100 | #171 | Average 11.7% |
| Trinidadians and Tobagonians | 52.7 /100 | #172 | Average 11.7% |
| Maltese | 50.6 /100 | #173 | Average 11.7% |
| Albanians | 50.0 /100 | #174 | Average 11.7% |