Immigrants from Hong Kong vs Eastern European Disability Age Under 5
COMPARE
Immigrants from Hong Kong
Eastern European
Disability Age Under 5
Disability Age Under 5 Comparison
Immigrants from Hong Kong
Eastern Europeans
0.95%
DISABILITY AGE UNDER 5
100.0/ 100
METRIC RATING
15th/ 347
METRIC RANK
1.4%
DISABILITY AGE UNDER 5
1.0/ 100
METRIC RATING
248th/ 347
METRIC RANK
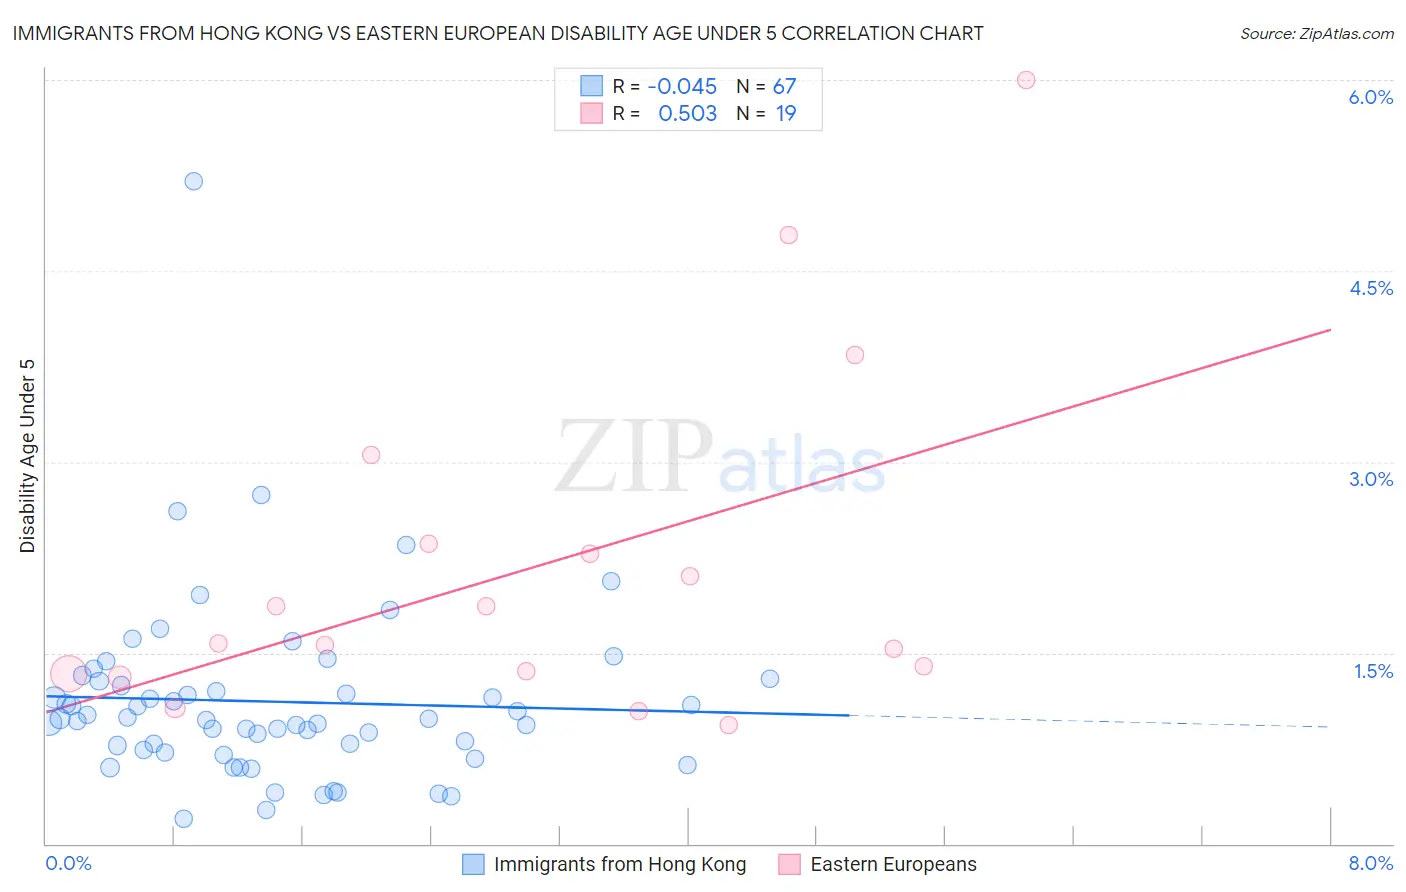
Immigrants from Hong Kong vs Eastern European Disability Age Under 5 Correlation Chart
The statistical analysis conducted on geographies consisting of 156,756,325 people shows no correlation between the proportion of Immigrants from Hong Kong and percentage of population with a disability under the age of 5 in the United States with a correlation coefficient (R) of -0.045 and weighted average of 0.95%. Similarly, the statistical analysis conducted on geographies consisting of 231,188,302 people shows a substantial positive correlation between the proportion of Eastern Europeans and percentage of population with a disability under the age of 5 in the United States with a correlation coefficient (R) of 0.503 and weighted average of 1.4%, a difference of 44.5%.
Disability Age Under 5 Correlation Summary
| Measurement | Immigrants from Hong Kong | Eastern European |
| Minimum | 0.19% | 0.93% |
| Maximum | 5.2% | 6.0% |
| Range | 5.0% | 5.1% |
| Mean | 1.1% | 2.2% |
| Median | 0.98% | 1.6% |
| Interquartile 25% (IQ1) | 0.73% | 1.3% |
| Interquartile 75% (IQ3) | 1.3% | 2.4% |
| Interquartile Range (IQR) | 0.55% | 1.0% |
| Standard Deviation (Sample) | 0.72% | 1.4% |
| Standard Deviation (Population) | 0.72% | 1.3% |
Similar Demographics by Disability Age Under 5
Demographics Similar to Immigrants from Hong Kong by Disability Age Under 5
In terms of disability age under 5, the demographic groups most similar to Immigrants from Hong Kong are Yuman (0.95%, a difference of 0.030%), Soviet Union (0.95%, a difference of 0.11%), Immigrants from Grenada (0.94%, a difference of 0.28%), Afghan (0.94%, a difference of 0.30%), and Marshallese (0.94%, a difference of 1.1%).
| Demographics | Rating | Rank | Disability Age Under 5 |
| Immigrants | Yemen | 100.0 /100 | #8 | Exceptional 0.91% |
| Immigrants | Fiji | 100.0 /100 | #9 | Exceptional 0.92% |
| Marshallese | 100.0 /100 | #10 | Exceptional 0.94% |
| Afghans | 100.0 /100 | #11 | Exceptional 0.94% |
| Immigrants | Grenada | 100.0 /100 | #12 | Exceptional 0.94% |
| Soviet Union | 100.0 /100 | #13 | Exceptional 0.95% |
| Yuman | 100.0 /100 | #14 | Exceptional 0.95% |
| Immigrants | Hong Kong | 100.0 /100 | #15 | Exceptional 0.95% |
| Immigrants | Israel | 100.0 /100 | #16 | Exceptional 0.96% |
| Immigrants | China | 100.0 /100 | #17 | Exceptional 0.96% |
| Immigrants | Barbados | 100.0 /100 | #18 | Exceptional 0.97% |
| Puget Sound Salish | 100.0 /100 | #19 | Exceptional 0.97% |
| Nepalese | 100.0 /100 | #20 | Exceptional 0.97% |
| British West Indians | 100.0 /100 | #21 | Exceptional 0.99% |
| Immigrants | Iran | 100.0 /100 | #22 | Exceptional 1.00% |
Demographics Similar to Eastern Europeans by Disability Age Under 5
In terms of disability age under 5, the demographic groups most similar to Eastern Europeans are Immigrants from England (1.4%, a difference of 0.030%), Russian (1.4%, a difference of 0.050%), Bermudan (1.4%, a difference of 0.080%), African (1.4%, a difference of 0.090%), and Immigrants from Hungary (1.4%, a difference of 0.12%).
| Demographics | Rating | Rank | Disability Age Under 5 |
| Maltese | 2.2 /100 | #241 | Tragic 1.3% |
| Lumbee | 2.1 /100 | #242 | Tragic 1.3% |
| Immigrants | Cameroon | 1.7 /100 | #243 | Tragic 1.4% |
| Spaniards | 1.4 /100 | #244 | Tragic 1.4% |
| Potawatomi | 1.1 /100 | #245 | Tragic 1.4% |
| Russians | 1.0 /100 | #246 | Tragic 1.4% |
| Immigrants | England | 1.0 /100 | #247 | Tragic 1.4% |
| Eastern Europeans | 1.0 /100 | #248 | Tragic 1.4% |
| Bermudans | 1.0 /100 | #249 | Tragic 1.4% |
| Africans | 1.0 /100 | #250 | Tragic 1.4% |
| Immigrants | Hungary | 1.0 /100 | #251 | Tragic 1.4% |
| Immigrants | Scotland | 0.9 /100 | #252 | Tragic 1.4% |
| Australians | 0.7 /100 | #253 | Tragic 1.4% |
| Immigrants | Brazil | 0.7 /100 | #254 | Tragic 1.4% |
| Immigrants | Liberia | 0.6 /100 | #255 | Tragic 1.4% |