Immigrants from Hong Kong vs Taiwanese Disability Age Under 5
COMPARE
Immigrants from Hong Kong
Taiwanese
Disability Age Under 5
Disability Age Under 5 Comparison
Immigrants from Hong Kong
Taiwanese
0.95%
DISABILITY AGE UNDER 5
100.0/ 100
METRIC RATING
15th/ 347
METRIC RANK
1.3%
DISABILITY AGE UNDER 5
6.1/ 100
METRIC RATING
227th/ 347
METRIC RANK
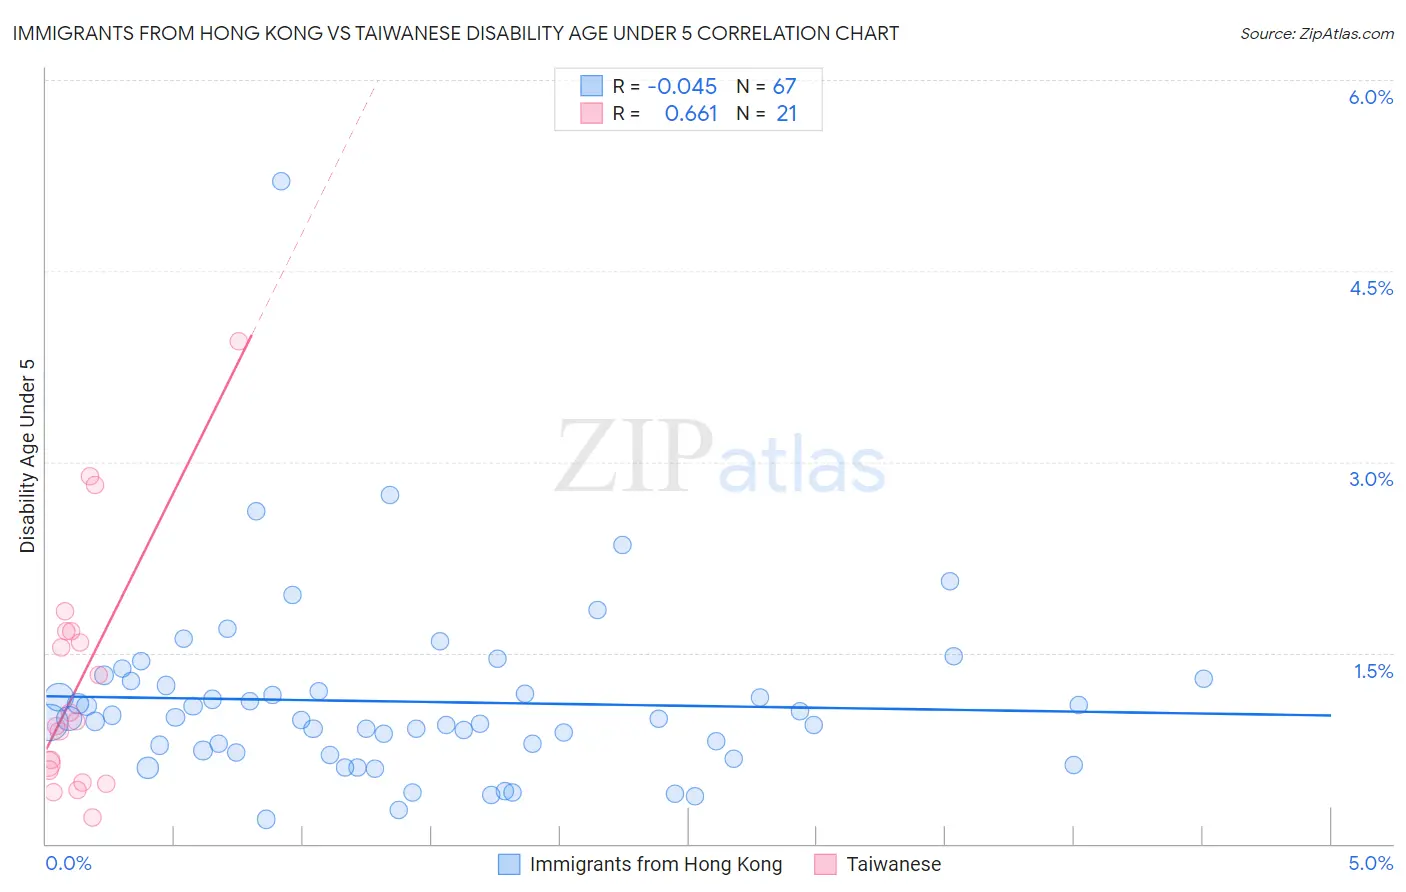
Immigrants from Hong Kong vs Taiwanese Disability Age Under 5 Correlation Chart
The statistical analysis conducted on geographies consisting of 156,756,325 people shows no correlation between the proportion of Immigrants from Hong Kong and percentage of population with a disability under the age of 5 in the United States with a correlation coefficient (R) of -0.045 and weighted average of 0.95%. Similarly, the statistical analysis conducted on geographies consisting of 29,016,682 people shows a significant positive correlation between the proportion of Taiwanese and percentage of population with a disability under the age of 5 in the United States with a correlation coefficient (R) of 0.661 and weighted average of 1.3%, a difference of 39.1%.
Disability Age Under 5 Correlation Summary
| Measurement | Immigrants from Hong Kong | Taiwanese |
| Minimum | 0.19% | 0.21% |
| Maximum | 5.2% | 4.0% |
| Range | 5.0% | 3.7% |
| Mean | 1.1% | 1.3% |
| Median | 0.98% | 0.96% |
| Interquartile 25% (IQ1) | 0.73% | 0.53% |
| Interquartile 75% (IQ3) | 1.3% | 1.7% |
| Interquartile Range (IQR) | 0.55% | 1.1% |
| Standard Deviation (Sample) | 0.72% | 0.96% |
| Standard Deviation (Population) | 0.72% | 0.94% |
Similar Demographics by Disability Age Under 5
Demographics Similar to Immigrants from Hong Kong by Disability Age Under 5
In terms of disability age under 5, the demographic groups most similar to Immigrants from Hong Kong are Yuman (0.95%, a difference of 0.030%), Soviet Union (0.95%, a difference of 0.11%), Immigrants from Grenada (0.94%, a difference of 0.28%), Afghan (0.94%, a difference of 0.30%), and Marshallese (0.94%, a difference of 1.1%).
| Demographics | Rating | Rank | Disability Age Under 5 |
| Immigrants | Yemen | 100.0 /100 | #8 | Exceptional 0.91% |
| Immigrants | Fiji | 100.0 /100 | #9 | Exceptional 0.92% |
| Marshallese | 100.0 /100 | #10 | Exceptional 0.94% |
| Afghans | 100.0 /100 | #11 | Exceptional 0.94% |
| Immigrants | Grenada | 100.0 /100 | #12 | Exceptional 0.94% |
| Soviet Union | 100.0 /100 | #13 | Exceptional 0.95% |
| Yuman | 100.0 /100 | #14 | Exceptional 0.95% |
| Immigrants | Hong Kong | 100.0 /100 | #15 | Exceptional 0.95% |
| Immigrants | Israel | 100.0 /100 | #16 | Exceptional 0.96% |
| Immigrants | China | 100.0 /100 | #17 | Exceptional 0.96% |
| Immigrants | Barbados | 100.0 /100 | #18 | Exceptional 0.97% |
| Puget Sound Salish | 100.0 /100 | #19 | Exceptional 0.97% |
| Nepalese | 100.0 /100 | #20 | Exceptional 0.97% |
| British West Indians | 100.0 /100 | #21 | Exceptional 0.99% |
| Immigrants | Iran | 100.0 /100 | #22 | Exceptional 1.00% |
Demographics Similar to Taiwanese by Disability Age Under 5
In terms of disability age under 5, the demographic groups most similar to Taiwanese are Luxembourger (1.3%, a difference of 0.010%), Immigrants from Costa Rica (1.3%, a difference of 0.23%), Lebanese (1.3%, a difference of 0.32%), Panamanian (1.3%, a difference of 0.34%), and Bahamian (1.3%, a difference of 0.34%).
| Demographics | Rating | Rank | Disability Age Under 5 |
| Serbians | 9.6 /100 | #220 | Tragic 1.3% |
| Sub-Saharan Africans | 8.3 /100 | #221 | Tragic 1.3% |
| Ukrainians | 8.3 /100 | #222 | Tragic 1.3% |
| Hispanics or Latinos | 7.7 /100 | #223 | Tragic 1.3% |
| Latvians | 7.1 /100 | #224 | Tragic 1.3% |
| Panamanians | 7.1 /100 | #225 | Tragic 1.3% |
| Bahamians | 7.1 /100 | #226 | Tragic 1.3% |
| Taiwanese | 6.1 /100 | #227 | Tragic 1.3% |
| Luxembourgers | 6.1 /100 | #228 | Tragic 1.3% |
| Immigrants | Costa Rica | 5.5 /100 | #229 | Tragic 1.3% |
| Lebanese | 5.3 /100 | #230 | Tragic 1.3% |
| Immigrants | Northern Europe | 4.7 /100 | #231 | Tragic 1.3% |
| French American Indians | 4.5 /100 | #232 | Tragic 1.3% |
| Tongans | 4.2 /100 | #233 | Tragic 1.3% |
| Pueblo | 3.8 /100 | #234 | Tragic 1.3% |