Immigrants from Haiti vs Moroccan Male Disability
COMPARE
Immigrants from Haiti
Moroccan
Male Disability
Male Disability Comparison
Immigrants from Haiti
Moroccans
11.1%
MALE DISABILITY
65.3/ 100
METRIC RATING
162nd/ 347
METRIC RANK
11.0%
MALE DISABILITY
80.7/ 100
METRIC RATING
143rd/ 347
METRIC RANK
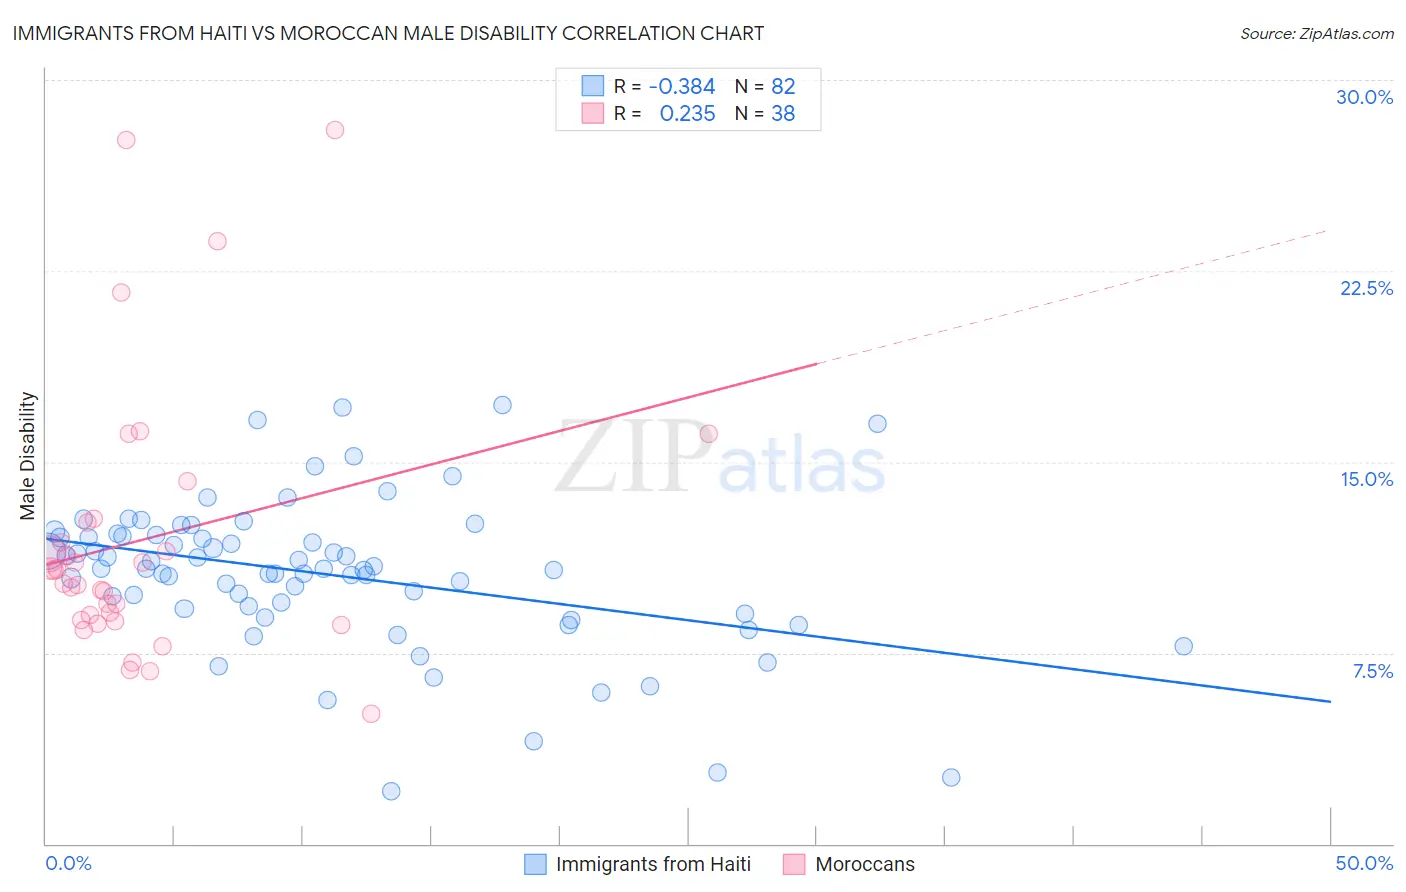
Immigrants from Haiti vs Moroccan Male Disability Correlation Chart
The statistical analysis conducted on geographies consisting of 225,231,442 people shows a mild negative correlation between the proportion of Immigrants from Haiti and percentage of males with a disability in the United States with a correlation coefficient (R) of -0.384 and weighted average of 11.1%. Similarly, the statistical analysis conducted on geographies consisting of 201,806,730 people shows a weak positive correlation between the proportion of Moroccans and percentage of males with a disability in the United States with a correlation coefficient (R) of 0.235 and weighted average of 11.0%, a difference of 1.1%.
Male Disability Correlation Summary
| Measurement | Immigrants from Haiti | Moroccan |
| Minimum | 2.1% | 5.1% |
| Maximum | 17.2% | 28.0% |
| Range | 15.1% | 22.9% |
| Mean | 10.6% | 11.9% |
| Median | 10.8% | 10.5% |
| Interquartile 25% (IQ1) | 9.2% | 8.8% |
| Interquartile 75% (IQ3) | 12.1% | 12.6% |
| Interquartile Range (IQR) | 2.8% | 3.8% |
| Standard Deviation (Sample) | 2.9% | 5.3% |
| Standard Deviation (Population) | 2.9% | 5.2% |
Demographics Similar to Immigrants from Haiti and Moroccans by Male Disability
In terms of male disability, the demographic groups most similar to Immigrants from Haiti are Immigrants from West Indies (11.1%, a difference of 0.020%), Albanian (11.1%, a difference of 0.070%), Guatemalan (11.1%, a difference of 0.12%), Latvian (11.1%, a difference of 0.18%), and Immigrants from Western Africa (11.1%, a difference of 0.25%). Similarly, the demographic groups most similar to Moroccans are Immigrants from Sudan (11.0%, a difference of 0.070%), Kenyan (11.0%, a difference of 0.22%), Costa Rican (11.0%, a difference of 0.23%), Korean (11.0%, a difference of 0.27%), and Immigrants from Croatia (11.0%, a difference of 0.29%).
| Demographics | Rating | Rank | Male Disability |
| Immigrants | Sudan | 81.5 /100 | #142 | Excellent 11.0% |
| Moroccans | 80.7 /100 | #143 | Excellent 11.0% |
| Kenyans | 78.1 /100 | #144 | Good 11.0% |
| Costa Ricans | 78.0 /100 | #145 | Good 11.0% |
| Koreans | 77.5 /100 | #146 | Good 11.0% |
| Immigrants | Croatia | 77.3 /100 | #147 | Good 11.0% |
| Sudanese | 77.1 /100 | #148 | Good 11.0% |
| Immigrants | Denmark | 76.4 /100 | #149 | Good 11.0% |
| Immigrants | Guatemala | 75.1 /100 | #150 | Good 11.0% |
| Cubans | 74.9 /100 | #151 | Good 11.0% |
| Immigrants | Albania | 74.4 /100 | #152 | Good 11.0% |
| Immigrants | Northern Europe | 73.2 /100 | #153 | Good 11.1% |
| Immigrants | Moldova | 72.8 /100 | #154 | Good 11.1% |
| Immigrants | Middle Africa | 70.9 /100 | #155 | Good 11.1% |
| Russians | 69.8 /100 | #156 | Good 11.1% |
| Immigrants | Western Africa | 69.2 /100 | #157 | Good 11.1% |
| Latvians | 68.1 /100 | #158 | Good 11.1% |
| Guatemalans | 67.2 /100 | #159 | Good 11.1% |
| Albanians | 66.5 /100 | #160 | Good 11.1% |
| Immigrants | West Indies | 65.7 /100 | #161 | Good 11.1% |
| Immigrants | Haiti | 65.3 /100 | #162 | Good 11.1% |