Immigrants from Haiti vs Shoshone Male Disability
COMPARE
Immigrants from Haiti
Shoshone
Male Disability
Male Disability Comparison
Immigrants from Haiti
Shoshone
11.1%
MALE DISABILITY
65.3/ 100
METRIC RATING
162nd/ 347
METRIC RANK
13.8%
MALE DISABILITY
0.0/ 100
METRIC RATING
321st/ 347
METRIC RANK
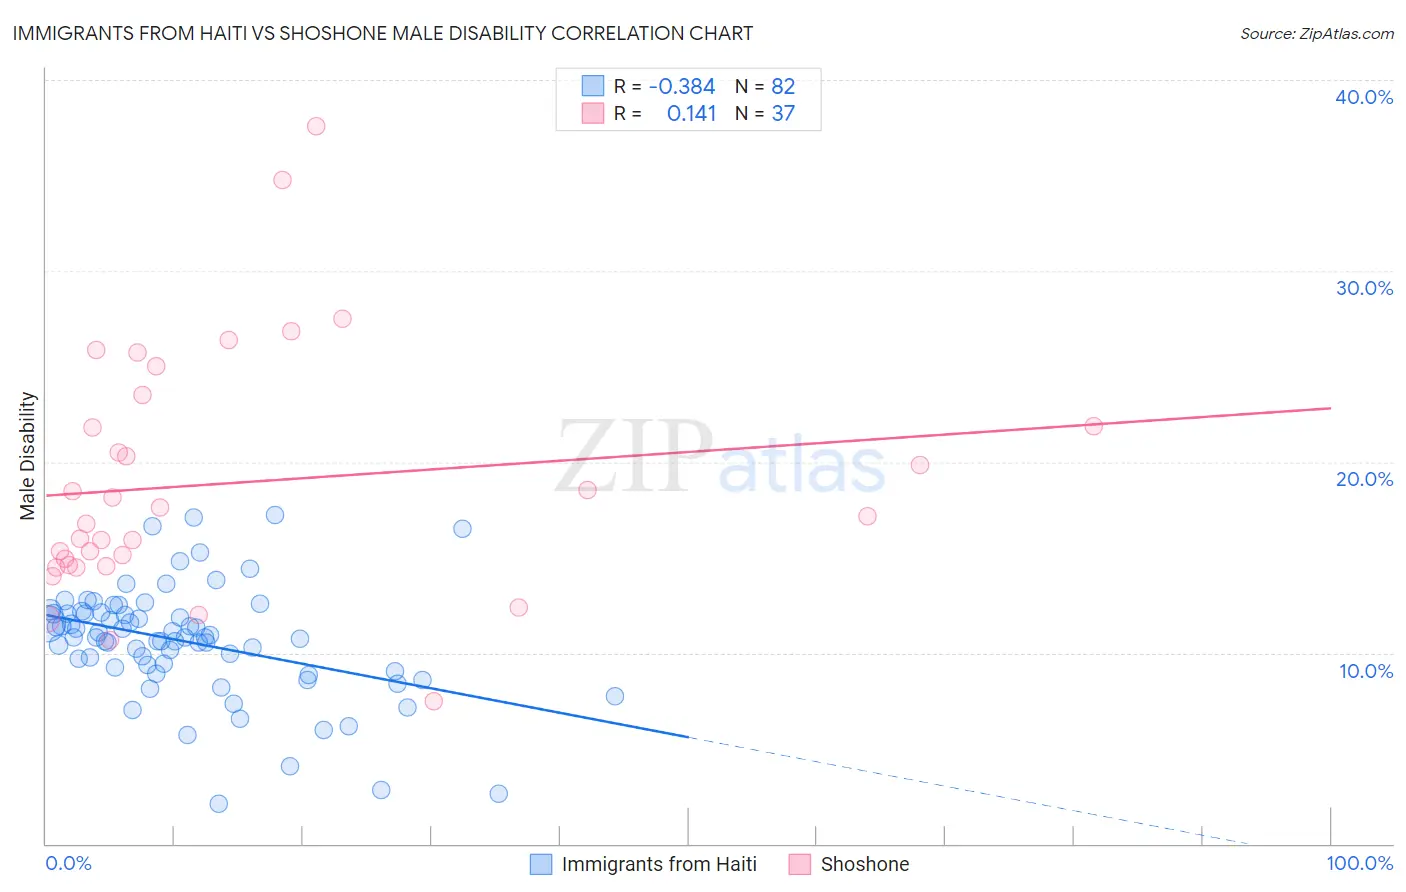
Immigrants from Haiti vs Shoshone Male Disability Correlation Chart
The statistical analysis conducted on geographies consisting of 225,231,442 people shows a mild negative correlation between the proportion of Immigrants from Haiti and percentage of males with a disability in the United States with a correlation coefficient (R) of -0.384 and weighted average of 11.1%. Similarly, the statistical analysis conducted on geographies consisting of 66,619,814 people shows a poor positive correlation between the proportion of Shoshone and percentage of males with a disability in the United States with a correlation coefficient (R) of 0.141 and weighted average of 13.8%, a difference of 24.5%.
Male Disability Correlation Summary
| Measurement | Immigrants from Haiti | Shoshone |
| Minimum | 2.1% | 7.4% |
| Maximum | 17.2% | 37.6% |
| Range | 15.1% | 30.1% |
| Mean | 10.6% | 18.9% |
| Median | 10.8% | 17.1% |
| Interquartile 25% (IQ1) | 9.2% | 14.6% |
| Interquartile 75% (IQ3) | 12.1% | 22.7% |
| Interquartile Range (IQR) | 2.8% | 8.1% |
| Standard Deviation (Sample) | 2.9% | 6.5% |
| Standard Deviation (Population) | 2.9% | 6.4% |
Similar Demographics by Male Disability
Demographics Similar to Immigrants from Haiti by Male Disability
In terms of male disability, the demographic groups most similar to Immigrants from Haiti are Immigrants from West Indies (11.1%, a difference of 0.020%), Albanian (11.1%, a difference of 0.070%), Immigrants from Kenya (11.1%, a difference of 0.090%), Guatemalan (11.1%, a difference of 0.12%), and British West Indian (11.1%, a difference of 0.15%).
| Demographics | Rating | Rank | Male Disability |
| Immigrants | Middle Africa | 70.9 /100 | #155 | Good 11.1% |
| Russians | 69.8 /100 | #156 | Good 11.1% |
| Immigrants | Western Africa | 69.2 /100 | #157 | Good 11.1% |
| Latvians | 68.1 /100 | #158 | Good 11.1% |
| Guatemalans | 67.2 /100 | #159 | Good 11.1% |
| Albanians | 66.5 /100 | #160 | Good 11.1% |
| Immigrants | West Indies | 65.7 /100 | #161 | Good 11.1% |
| Immigrants | Haiti | 65.3 /100 | #162 | Good 11.1% |
| Immigrants | Kenya | 63.8 /100 | #163 | Good 11.1% |
| British West Indians | 62.8 /100 | #164 | Good 11.1% |
| Luxembourgers | 61.9 /100 | #165 | Good 11.1% |
| Immigrants | Hungary | 61.2 /100 | #166 | Good 11.1% |
| Immigrants | Southern Europe | 54.4 /100 | #167 | Average 11.2% |
| Immigrants | Latin America | 54.0 /100 | #168 | Average 11.2% |
| Barbadians | 53.4 /100 | #169 | Average 11.2% |
Demographics Similar to Shoshone by Male Disability
In terms of male disability, the demographic groups most similar to Shoshone are Tlingit-Haida (13.8%, a difference of 0.050%), American (13.8%, a difference of 0.54%), Cree (13.7%, a difference of 0.96%), Apache (14.0%, a difference of 1.1%), and Paiute (13.7%, a difference of 1.2%).
| Demographics | Rating | Rank | Male Disability |
| Aleuts | 0.0 /100 | #314 | Tragic 13.5% |
| Iroquois | 0.0 /100 | #315 | Tragic 13.6% |
| Alaska Natives | 0.0 /100 | #316 | Tragic 13.6% |
| Paiute | 0.0 /100 | #317 | Tragic 13.7% |
| Cree | 0.0 /100 | #318 | Tragic 13.7% |
| Americans | 0.0 /100 | #319 | Tragic 13.8% |
| Tlingit-Haida | 0.0 /100 | #320 | Tragic 13.8% |
| Shoshone | 0.0 /100 | #321 | Tragic 13.8% |
| Apache | 0.0 /100 | #322 | Tragic 14.0% |
| Osage | 0.0 /100 | #323 | Tragic 14.0% |
| Comanche | 0.0 /100 | #324 | Tragic 14.1% |
| Ottawa | 0.0 /100 | #325 | Tragic 14.1% |
| Natives/Alaskans | 0.0 /100 | #326 | Tragic 14.2% |
| Potawatomi | 0.0 /100 | #327 | Tragic 14.2% |
| Chippewa | 0.0 /100 | #328 | Tragic 14.3% |