Immigrants from Haiti vs Moroccan Single Mother Households
COMPARE
Immigrants from Haiti
Moroccan
Single Mother Households
Single Mother Households Comparison
Immigrants from Haiti
Moroccans
8.4%
SINGLE MOTHER HOUSEHOLDS
0.0/ 100
METRIC RATING
327th/ 347
METRIC RANK
6.6%
SINGLE MOTHER HOUSEHOLDS
17.4/ 100
METRIC RATING
197th/ 347
METRIC RANK
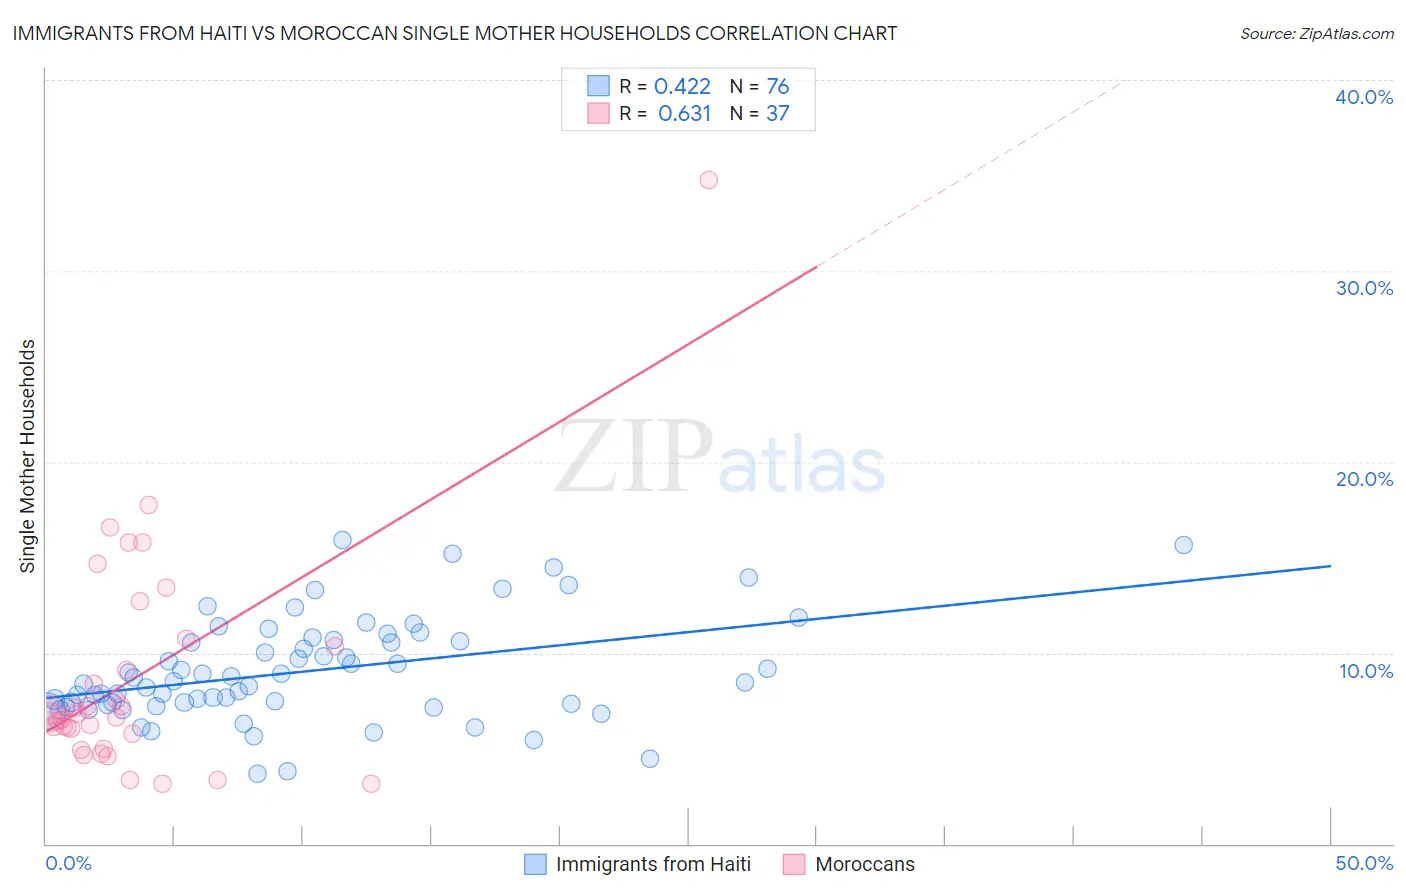
Immigrants from Haiti vs Moroccan Single Mother Households Correlation Chart
The statistical analysis conducted on geographies consisting of 224,778,467 people shows a moderate positive correlation between the proportion of Immigrants from Haiti and percentage of single mother households in the United States with a correlation coefficient (R) of 0.422 and weighted average of 8.4%. Similarly, the statistical analysis conducted on geographies consisting of 201,586,656 people shows a significant positive correlation between the proportion of Moroccans and percentage of single mother households in the United States with a correlation coefficient (R) of 0.631 and weighted average of 6.6%, a difference of 27.6%.
Single Mother Households Correlation Summary
| Measurement | Immigrants from Haiti | Moroccan |
| Minimum | 3.7% | 3.1% |
| Maximum | 15.9% | 34.7% |
| Range | 12.2% | 31.6% |
| Mean | 9.0% | 8.7% |
| Median | 8.5% | 6.8% |
| Interquartile 25% (IQ1) | 7.3% | 5.4% |
| Interquartile 75% (IQ3) | 10.6% | 10.6% |
| Interquartile Range (IQR) | 3.3% | 5.2% |
| Standard Deviation (Sample) | 2.7% | 5.9% |
| Standard Deviation (Population) | 2.7% | 5.9% |
Similar Demographics by Single Mother Households
Demographics Similar to Immigrants from Haiti by Single Mother Households
In terms of single mother households, the demographic groups most similar to Immigrants from Haiti are British West Indian (8.4%, a difference of 0.15%), Yakama (8.4%, a difference of 0.18%), Immigrants from Caribbean (8.4%, a difference of 0.27%), Immigrants from Jamaica (8.4%, a difference of 0.46%), and Haitian (8.3%, a difference of 0.89%).
| Demographics | Rating | Rank | Single Mother Households |
| Bahamians | 0.0 /100 | #320 | Tragic 8.3% |
| Immigrants | Senegal | 0.0 /100 | #321 | Tragic 8.3% |
| Pima | 0.0 /100 | #322 | Tragic 8.3% |
| Haitians | 0.0 /100 | #323 | Tragic 8.3% |
| Immigrants | Jamaica | 0.0 /100 | #324 | Tragic 8.4% |
| Immigrants | Caribbean | 0.0 /100 | #325 | Tragic 8.4% |
| British West Indians | 0.0 /100 | #326 | Tragic 8.4% |
| Immigrants | Haiti | 0.0 /100 | #327 | Tragic 8.4% |
| Yakama | 0.0 /100 | #328 | Tragic 8.4% |
| Hopi | 0.0 /100 | #329 | Tragic 8.5% |
| Inupiat | 0.0 /100 | #330 | Tragic 8.5% |
| Sioux | 0.0 /100 | #331 | Tragic 8.5% |
| U.S. Virgin Islanders | 0.0 /100 | #332 | Tragic 8.6% |
| Liberians | 0.0 /100 | #333 | Tragic 8.6% |
| Immigrants | Liberia | 0.0 /100 | #334 | Tragic 8.7% |
Demographics Similar to Moroccans by Single Mother Households
In terms of single mother households, the demographic groups most similar to Moroccans are South American (6.6%, a difference of 0.11%), Uruguayan (6.6%, a difference of 0.11%), Immigrants from Uganda (6.6%, a difference of 0.15%), Colombian (6.6%, a difference of 0.16%), and Hawaiian (6.6%, a difference of 0.25%).
| Demographics | Rating | Rank | Single Mother Households |
| Peruvians | 21.6 /100 | #190 | Fair 6.5% |
| Samoans | 21.2 /100 | #191 | Fair 6.5% |
| Americans | 19.0 /100 | #192 | Poor 6.6% |
| Colombians | 18.3 /100 | #193 | Poor 6.6% |
| Immigrants | Uganda | 18.3 /100 | #194 | Poor 6.6% |
| South Americans | 18.0 /100 | #195 | Poor 6.6% |
| Uruguayans | 18.0 /100 | #196 | Poor 6.6% |
| Moroccans | 17.4 /100 | #197 | Poor 6.6% |
| Hawaiians | 16.1 /100 | #198 | Poor 6.6% |
| Potawatomi | 15.5 /100 | #199 | Poor 6.6% |
| Immigrants | Ethiopia | 14.7 /100 | #200 | Poor 6.6% |
| Venezuelans | 12.9 /100 | #201 | Poor 6.6% |
| Guamanians/Chamorros | 12.4 /100 | #202 | Poor 6.6% |
| Immigrants | Peru | 12.0 /100 | #203 | Poor 6.7% |
| Immigrants | Fiji | 11.9 /100 | #204 | Poor 6.7% |