Immigrants from Haiti vs Immigrants from Trinidad and Tobago Male Disability
COMPARE
Immigrants from Haiti
Immigrants from Trinidad and Tobago
Male Disability
Male Disability Comparison
Immigrants from Haiti
Immigrants from Trinidad and Tobago
11.1%
MALE DISABILITY
65.3/ 100
METRIC RATING
162nd/ 347
METRIC RANK
10.9%
MALE DISABILITY
86.9/ 100
METRIC RATING
126th/ 347
METRIC RANK
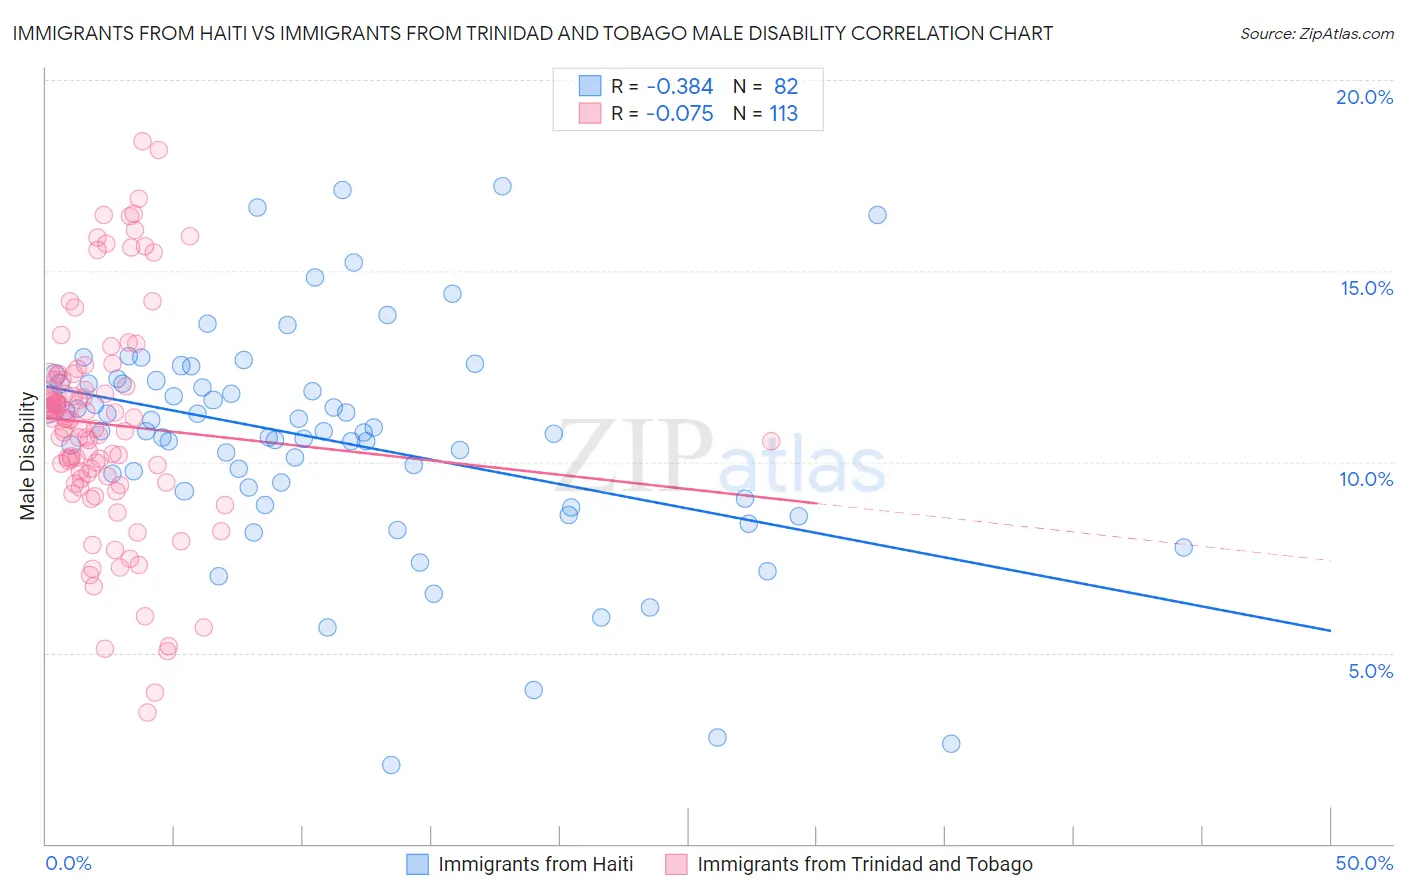
Immigrants from Haiti vs Immigrants from Trinidad and Tobago Male Disability Correlation Chart
The statistical analysis conducted on geographies consisting of 225,231,442 people shows a mild negative correlation between the proportion of Immigrants from Haiti and percentage of males with a disability in the United States with a correlation coefficient (R) of -0.384 and weighted average of 11.1%. Similarly, the statistical analysis conducted on geographies consisting of 223,502,248 people shows a slight negative correlation between the proportion of Immigrants from Trinidad and Tobago and percentage of males with a disability in the United States with a correlation coefficient (R) of -0.075 and weighted average of 10.9%, a difference of 1.8%.
Male Disability Correlation Summary
| Measurement | Immigrants from Haiti | Immigrants from Trinidad and Tobago |
| Minimum | 2.1% | 3.4% |
| Maximum | 17.2% | 18.4% |
| Range | 15.1% | 14.9% |
| Mean | 10.6% | 11.0% |
| Median | 10.8% | 11.1% |
| Interquartile 25% (IQ1) | 9.2% | 9.5% |
| Interquartile 75% (IQ3) | 12.1% | 12.2% |
| Interquartile Range (IQR) | 2.8% | 2.7% |
| Standard Deviation (Sample) | 2.9% | 2.9% |
| Standard Deviation (Population) | 2.9% | 2.9% |
Similar Demographics by Male Disability
Demographics Similar to Immigrants from Haiti by Male Disability
In terms of male disability, the demographic groups most similar to Immigrants from Haiti are Immigrants from West Indies (11.1%, a difference of 0.020%), Albanian (11.1%, a difference of 0.070%), Immigrants from Kenya (11.1%, a difference of 0.090%), Guatemalan (11.1%, a difference of 0.12%), and British West Indian (11.1%, a difference of 0.15%).
| Demographics | Rating | Rank | Male Disability |
| Immigrants | Middle Africa | 70.9 /100 | #155 | Good 11.1% |
| Russians | 69.8 /100 | #156 | Good 11.1% |
| Immigrants | Western Africa | 69.2 /100 | #157 | Good 11.1% |
| Latvians | 68.1 /100 | #158 | Good 11.1% |
| Guatemalans | 67.2 /100 | #159 | Good 11.1% |
| Albanians | 66.5 /100 | #160 | Good 11.1% |
| Immigrants | West Indies | 65.7 /100 | #161 | Good 11.1% |
| Immigrants | Haiti | 65.3 /100 | #162 | Good 11.1% |
| Immigrants | Kenya | 63.8 /100 | #163 | Good 11.1% |
| British West Indians | 62.8 /100 | #164 | Good 11.1% |
| Luxembourgers | 61.9 /100 | #165 | Good 11.1% |
| Immigrants | Hungary | 61.2 /100 | #166 | Good 11.1% |
| Immigrants | Southern Europe | 54.4 /100 | #167 | Average 11.2% |
| Immigrants | Latin America | 54.0 /100 | #168 | Average 11.2% |
| Barbadians | 53.4 /100 | #169 | Average 11.2% |
Demographics Similar to Immigrants from Trinidad and Tobago by Male Disability
In terms of male disability, the demographic groups most similar to Immigrants from Trinidad and Tobago are Immigrants from Ukraine (10.9%, a difference of 0.010%), South American Indian (10.9%, a difference of 0.16%), Immigrants from North Macedonia (10.9%, a difference of 0.16%), Immigrants from Latvia (10.9%, a difference of 0.17%), and Immigrants from Philippines (10.9%, a difference of 0.17%).
| Demographics | Rating | Rank | Male Disability |
| Armenians | 90.1 /100 | #119 | Exceptional 10.9% |
| Immigrants | Africa | 89.4 /100 | #120 | Excellent 10.9% |
| Immigrants | South Eastern Asia | 89.2 /100 | #121 | Excellent 10.9% |
| Immigrants | Ghana | 89.0 /100 | #122 | Excellent 10.9% |
| Immigrants | Czechoslovakia | 88.4 /100 | #123 | Excellent 10.9% |
| South American Indians | 88.1 /100 | #124 | Excellent 10.9% |
| Immigrants | North Macedonia | 88.1 /100 | #125 | Excellent 10.9% |
| Immigrants | Trinidad and Tobago | 86.9 /100 | #126 | Excellent 10.9% |
| Immigrants | Ukraine | 86.8 /100 | #127 | Excellent 10.9% |
| Immigrants | Latvia | 85.5 /100 | #128 | Excellent 10.9% |
| Immigrants | Philippines | 85.4 /100 | #129 | Excellent 10.9% |
| Brazilians | 85.4 /100 | #130 | Excellent 10.9% |
| Macedonians | 84.2 /100 | #131 | Excellent 11.0% |
| Immigrants | Fiji | 84.0 /100 | #132 | Excellent 11.0% |
| Ugandans | 83.9 /100 | #133 | Excellent 11.0% |