Immigrants from Iran vs Moroccan Male Disability
COMPARE
Immigrants from Iran
Moroccan
Male Disability
Male Disability Comparison
Immigrants from Iran
Moroccans
9.7%
MALE DISABILITY
100.0/ 100
METRIC RATING
14th/ 347
METRIC RANK
11.0%
MALE DISABILITY
80.7/ 100
METRIC RATING
143rd/ 347
METRIC RANK
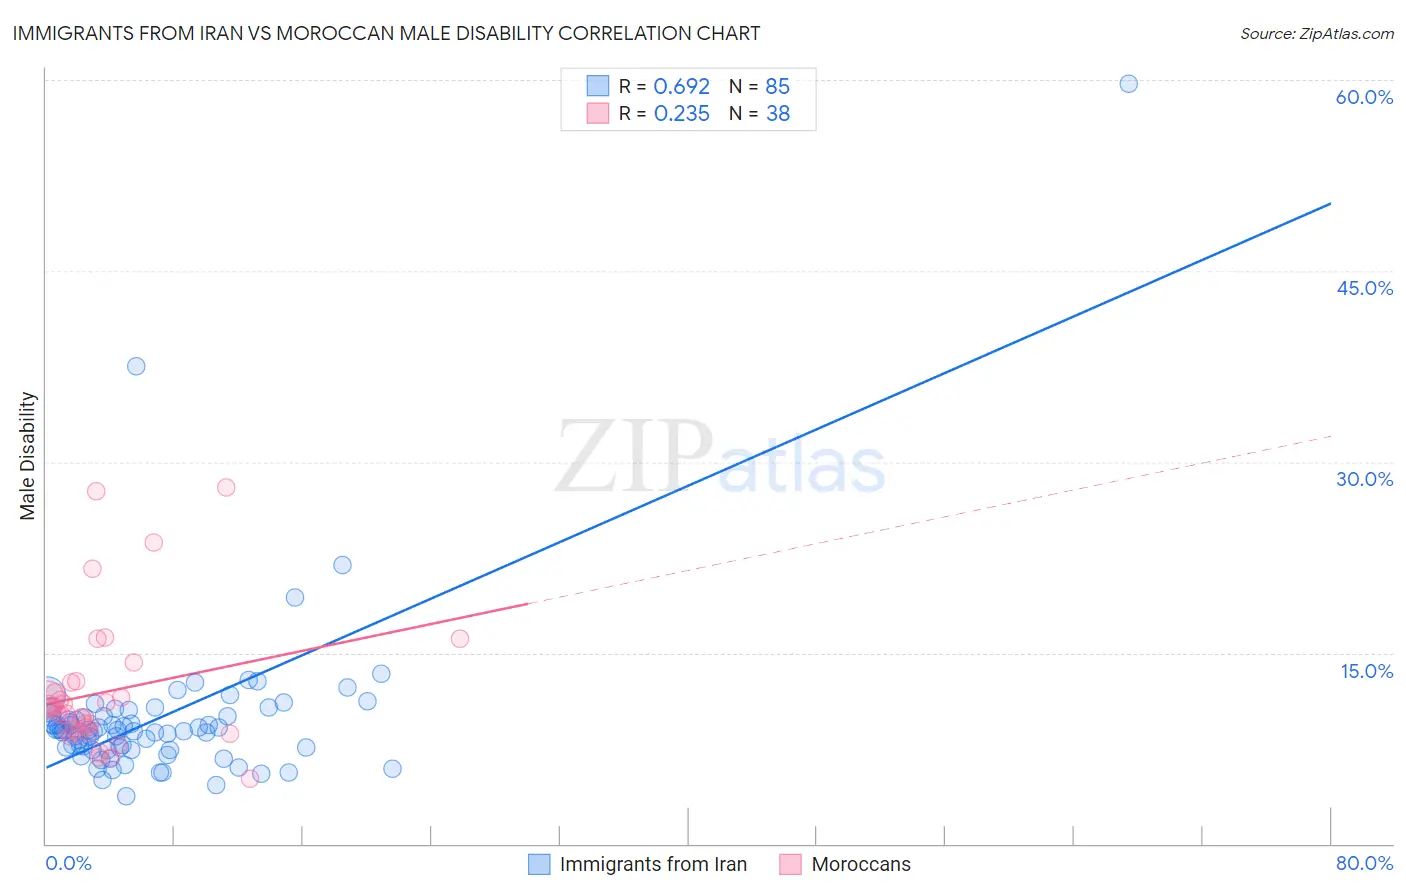
Immigrants from Iran vs Moroccan Male Disability Correlation Chart
The statistical analysis conducted on geographies consisting of 279,892,018 people shows a significant positive correlation between the proportion of Immigrants from Iran and percentage of males with a disability in the United States with a correlation coefficient (R) of 0.692 and weighted average of 9.7%. Similarly, the statistical analysis conducted on geographies consisting of 201,806,730 people shows a weak positive correlation between the proportion of Moroccans and percentage of males with a disability in the United States with a correlation coefficient (R) of 0.235 and weighted average of 11.0%, a difference of 13.7%.
Male Disability Correlation Summary
| Measurement | Immigrants from Iran | Moroccan |
| Minimum | 3.8% | 5.1% |
| Maximum | 59.7% | 28.0% |
| Range | 55.9% | 22.9% |
| Mean | 9.9% | 11.9% |
| Median | 8.9% | 10.5% |
| Interquartile 25% (IQ1) | 7.5% | 8.8% |
| Interquartile 75% (IQ3) | 10.1% | 12.6% |
| Interquartile Range (IQR) | 2.6% | 3.8% |
| Standard Deviation (Sample) | 6.8% | 5.3% |
| Standard Deviation (Population) | 6.8% | 5.2% |
Similar Demographics by Male Disability
Demographics Similar to Immigrants from Iran by Male Disability
In terms of male disability, the demographic groups most similar to Immigrants from Iran are Iranian (9.7%, a difference of 0.10%), Bolivian (9.6%, a difference of 0.33%), Indian (Asian) (9.7%, a difference of 0.45%), Immigrants from Eastern Asia (9.6%, a difference of 0.56%), and Okinawan (9.8%, a difference of 1.1%).
| Demographics | Rating | Rank | Male Disability |
| Immigrants | Bolivia | 100.0 /100 | #7 | Exceptional 9.5% |
| Immigrants | China | 100.0 /100 | #8 | Exceptional 9.5% |
| Immigrants | Singapore | 100.0 /100 | #9 | Exceptional 9.5% |
| Immigrants | Israel | 100.0 /100 | #10 | Exceptional 9.6% |
| Immigrants | Eastern Asia | 100.0 /100 | #11 | Exceptional 9.6% |
| Bolivians | 100.0 /100 | #12 | Exceptional 9.6% |
| Iranians | 100.0 /100 | #13 | Exceptional 9.7% |
| Immigrants | Iran | 100.0 /100 | #14 | Exceptional 9.7% |
| Indians (Asian) | 100.0 /100 | #15 | Exceptional 9.7% |
| Okinawans | 100.0 /100 | #16 | Exceptional 9.8% |
| Immigrants | Korea | 100.0 /100 | #17 | Exceptional 9.8% |
| Immigrants | Pakistan | 100.0 /100 | #18 | Exceptional 9.8% |
| Immigrants | Sri Lanka | 100.0 /100 | #19 | Exceptional 10.0% |
| Asians | 100.0 /100 | #20 | Exceptional 10.0% |
| Burmese | 100.0 /100 | #21 | Exceptional 10.0% |
Demographics Similar to Moroccans by Male Disability
In terms of male disability, the demographic groups most similar to Moroccans are Immigrants from Italy (11.0%, a difference of 0.070%), Arab (11.0%, a difference of 0.070%), Immigrants from Sudan (11.0%, a difference of 0.070%), South African (11.0%, a difference of 0.090%), and Nigerian (11.0%, a difference of 0.11%).
| Demographics | Rating | Rank | Male Disability |
| Immigrants | Costa Rica | 82.8 /100 | #136 | Excellent 11.0% |
| Immigrants | Europe | 82.0 /100 | #137 | Excellent 11.0% |
| Nigerians | 81.9 /100 | #138 | Excellent 11.0% |
| South Africans | 81.7 /100 | #139 | Excellent 11.0% |
| Immigrants | Italy | 81.5 /100 | #140 | Excellent 11.0% |
| Arabs | 81.5 /100 | #141 | Excellent 11.0% |
| Immigrants | Sudan | 81.5 /100 | #142 | Excellent 11.0% |
| Moroccans | 80.7 /100 | #143 | Excellent 11.0% |
| Kenyans | 78.1 /100 | #144 | Good 11.0% |
| Costa Ricans | 78.0 /100 | #145 | Good 11.0% |
| Koreans | 77.5 /100 | #146 | Good 11.0% |
| Immigrants | Croatia | 77.3 /100 | #147 | Good 11.0% |
| Sudanese | 77.1 /100 | #148 | Good 11.0% |
| Immigrants | Denmark | 76.4 /100 | #149 | Good 11.0% |
| Immigrants | Guatemala | 75.1 /100 | #150 | Good 11.0% |