Immigrants from Haiti vs Immigrants from Kenya Male Disability
COMPARE
Immigrants from Haiti
Immigrants from Kenya
Male Disability
Male Disability Comparison
Immigrants from Haiti
Immigrants from Kenya
11.1%
MALE DISABILITY
65.3/ 100
METRIC RATING
162nd/ 347
METRIC RANK
11.1%
MALE DISABILITY
63.8/ 100
METRIC RATING
163rd/ 347
METRIC RANK
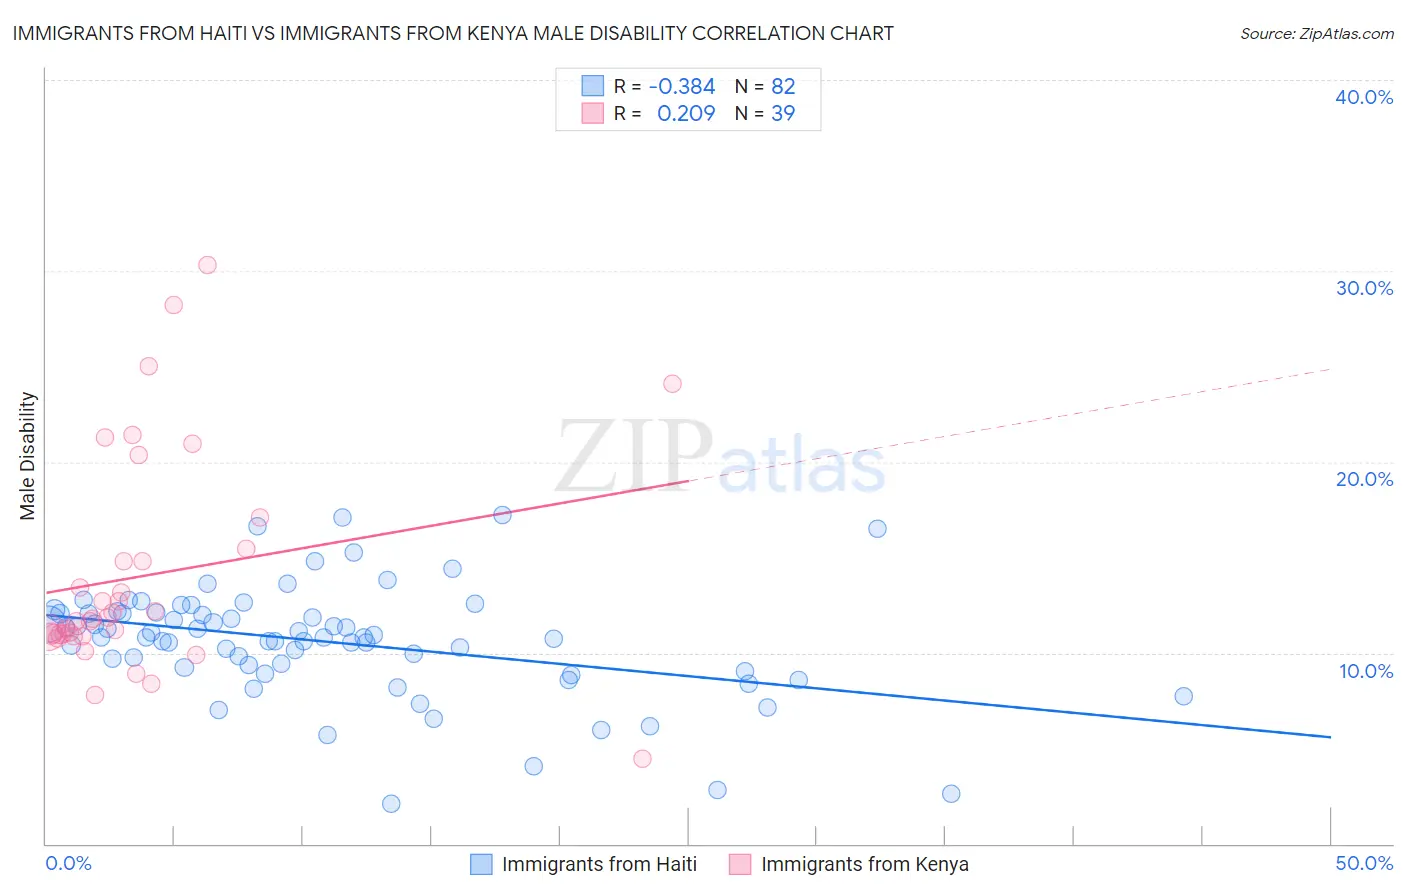
Immigrants from Haiti vs Immigrants from Kenya Male Disability Correlation Chart
The statistical analysis conducted on geographies consisting of 225,231,442 people shows a mild negative correlation between the proportion of Immigrants from Haiti and percentage of males with a disability in the United States with a correlation coefficient (R) of -0.384 and weighted average of 11.1%. Similarly, the statistical analysis conducted on geographies consisting of 218,057,071 people shows a weak positive correlation between the proportion of Immigrants from Kenya and percentage of males with a disability in the United States with a correlation coefficient (R) of 0.209 and weighted average of 11.1%, a difference of 0.090%.
Male Disability Correlation Summary
| Measurement | Immigrants from Haiti | Immigrants from Kenya |
| Minimum | 2.1% | 4.4% |
| Maximum | 17.2% | 30.3% |
| Range | 15.1% | 25.8% |
| Mean | 10.6% | 14.0% |
| Median | 10.8% | 11.8% |
| Interquartile 25% (IQ1) | 9.2% | 11.0% |
| Interquartile 75% (IQ3) | 12.1% | 15.4% |
| Interquartile Range (IQR) | 2.8% | 4.4% |
| Standard Deviation (Sample) | 2.9% | 5.7% |
| Standard Deviation (Population) | 2.9% | 5.7% |
Demographics Similar to Immigrants from Haiti and Immigrants from Kenya by Male Disability
In terms of male disability, the demographic groups most similar to Immigrants from Haiti are Immigrants from West Indies (11.1%, a difference of 0.020%), Albanian (11.1%, a difference of 0.070%), Guatemalan (11.1%, a difference of 0.12%), British West Indian (11.1%, a difference of 0.15%), and Latvian (11.1%, a difference of 0.18%). Similarly, the demographic groups most similar to Immigrants from Kenya are British West Indian (11.1%, a difference of 0.060%), Luxembourger (11.1%, a difference of 0.11%), Immigrants from West Indies (11.1%, a difference of 0.12%), Immigrants from Hungary (11.1%, a difference of 0.15%), and Albanian (11.1%, a difference of 0.16%).
| Demographics | Rating | Rank | Male Disability |
| Immigrants | Albania | 74.4 /100 | #152 | Good 11.0% |
| Immigrants | Northern Europe | 73.2 /100 | #153 | Good 11.1% |
| Immigrants | Moldova | 72.8 /100 | #154 | Good 11.1% |
| Immigrants | Middle Africa | 70.9 /100 | #155 | Good 11.1% |
| Russians | 69.8 /100 | #156 | Good 11.1% |
| Immigrants | Western Africa | 69.2 /100 | #157 | Good 11.1% |
| Latvians | 68.1 /100 | #158 | Good 11.1% |
| Guatemalans | 67.2 /100 | #159 | Good 11.1% |
| Albanians | 66.5 /100 | #160 | Good 11.1% |
| Immigrants | West Indies | 65.7 /100 | #161 | Good 11.1% |
| Immigrants | Haiti | 65.3 /100 | #162 | Good 11.1% |
| Immigrants | Kenya | 63.8 /100 | #163 | Good 11.1% |
| British West Indians | 62.8 /100 | #164 | Good 11.1% |
| Luxembourgers | 61.9 /100 | #165 | Good 11.1% |
| Immigrants | Hungary | 61.2 /100 | #166 | Good 11.1% |
| Immigrants | Southern Europe | 54.4 /100 | #167 | Average 11.2% |
| Immigrants | Latin America | 54.0 /100 | #168 | Average 11.2% |
| Barbadians | 53.4 /100 | #169 | Average 11.2% |
| New Zealanders | 52.9 /100 | #170 | Average 11.2% |
| Haitians | 52.5 /100 | #171 | Average 11.2% |
| Romanians | 50.7 /100 | #172 | Average 11.2% |