Immigrants from Haiti vs Syrian Male Disability
COMPARE
Immigrants from Haiti
Syrian
Male Disability
Male Disability Comparison
Immigrants from Haiti
Syrians
11.1%
MALE DISABILITY
65.3/ 100
METRIC RATING
162nd/ 347
METRIC RANK
11.2%
MALE DISABILITY
46.6/ 100
METRIC RATING
176th/ 347
METRIC RANK
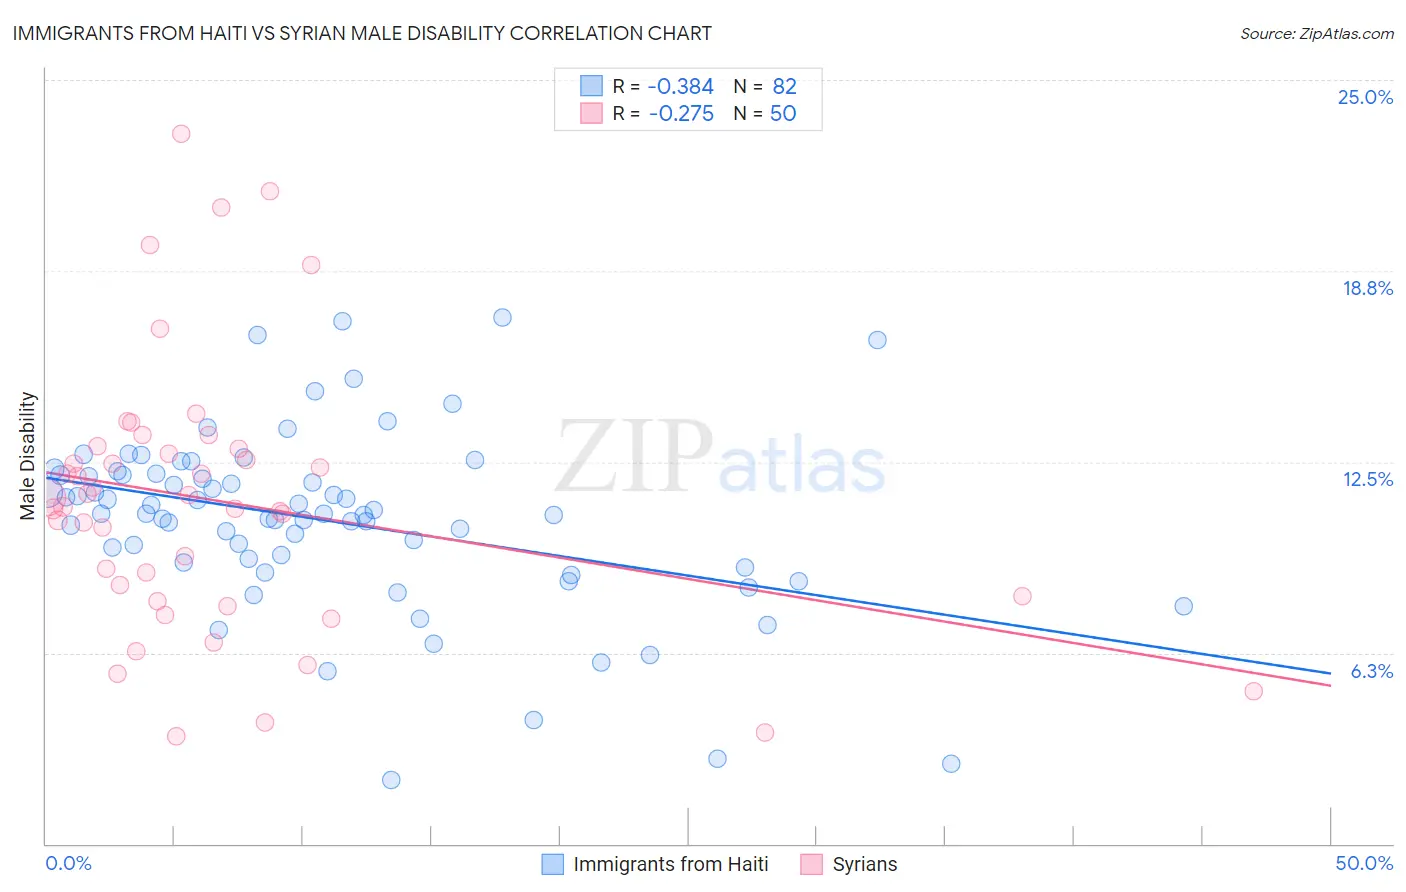
Immigrants from Haiti vs Syrian Male Disability Correlation Chart
The statistical analysis conducted on geographies consisting of 225,231,442 people shows a mild negative correlation between the proportion of Immigrants from Haiti and percentage of males with a disability in the United States with a correlation coefficient (R) of -0.384 and weighted average of 11.1%. Similarly, the statistical analysis conducted on geographies consisting of 266,314,155 people shows a weak negative correlation between the proportion of Syrians and percentage of males with a disability in the United States with a correlation coefficient (R) of -0.275 and weighted average of 11.2%, a difference of 1.1%.
Male Disability Correlation Summary
| Measurement | Immigrants from Haiti | Syrian |
| Minimum | 2.1% | 3.5% |
| Maximum | 17.2% | 23.2% |
| Range | 15.1% | 19.7% |
| Mean | 10.6% | 11.2% |
| Median | 10.8% | 11.2% |
| Interquartile 25% (IQ1) | 9.2% | 8.1% |
| Interquartile 75% (IQ3) | 12.1% | 12.9% |
| Interquartile Range (IQR) | 2.8% | 4.8% |
| Standard Deviation (Sample) | 2.9% | 4.4% |
| Standard Deviation (Population) | 2.9% | 4.4% |
Demographics Similar to Immigrants from Haiti and Syrians by Male Disability
In terms of male disability, the demographic groups most similar to Immigrants from Haiti are Immigrants from West Indies (11.1%, a difference of 0.020%), Albanian (11.1%, a difference of 0.070%), Immigrants from Kenya (11.1%, a difference of 0.090%), Guatemalan (11.1%, a difference of 0.12%), and British West Indian (11.1%, a difference of 0.15%). Similarly, the demographic groups most similar to Syrians are Immigrants from Honduras (11.2%, a difference of 0.12%), Immigrants from Norway (11.3%, a difference of 0.13%), Maltese (11.2%, a difference of 0.19%), Immigrants from Burma/Myanmar (11.2%, a difference of 0.21%), and Romanian (11.2%, a difference of 0.23%).
| Demographics | Rating | Rank | Male Disability |
| Guatemalans | 67.2 /100 | #159 | Good 11.1% |
| Albanians | 66.5 /100 | #160 | Good 11.1% |
| Immigrants | West Indies | 65.7 /100 | #161 | Good 11.1% |
| Immigrants | Haiti | 65.3 /100 | #162 | Good 11.1% |
| Immigrants | Kenya | 63.8 /100 | #163 | Good 11.1% |
| British West Indians | 62.8 /100 | #164 | Good 11.1% |
| Luxembourgers | 61.9 /100 | #165 | Good 11.1% |
| Immigrants | Hungary | 61.2 /100 | #166 | Good 11.1% |
| Immigrants | Southern Europe | 54.4 /100 | #167 | Average 11.2% |
| Immigrants | Latin America | 54.0 /100 | #168 | Average 11.2% |
| Barbadians | 53.4 /100 | #169 | Average 11.2% |
| New Zealanders | 52.9 /100 | #170 | Average 11.2% |
| Haitians | 52.5 /100 | #171 | Average 11.2% |
| Romanians | 50.7 /100 | #172 | Average 11.2% |
| Immigrants | Burma/Myanmar | 50.4 /100 | #173 | Average 11.2% |
| Maltese | 50.0 /100 | #174 | Average 11.2% |
| Immigrants | Honduras | 48.7 /100 | #175 | Average 11.2% |
| Syrians | 46.6 /100 | #176 | Average 11.2% |
| Immigrants | Norway | 44.2 /100 | #177 | Average 11.3% |
| Australians | 42.2 /100 | #178 | Average 11.3% |
| Immigrants | Caribbean | 41.4 /100 | #179 | Average 11.3% |