Northern European vs Immigrants from Trinidad and Tobago Male Disability
COMPARE
Northern European
Immigrants from Trinidad and Tobago
Male Disability
Male Disability Comparison
Northern Europeans
Immigrants from Trinidad and Tobago
11.9%
MALE DISABILITY
1.1/ 100
METRIC RATING
242nd/ 347
METRIC RANK
10.9%
MALE DISABILITY
86.9/ 100
METRIC RATING
126th/ 347
METRIC RANK
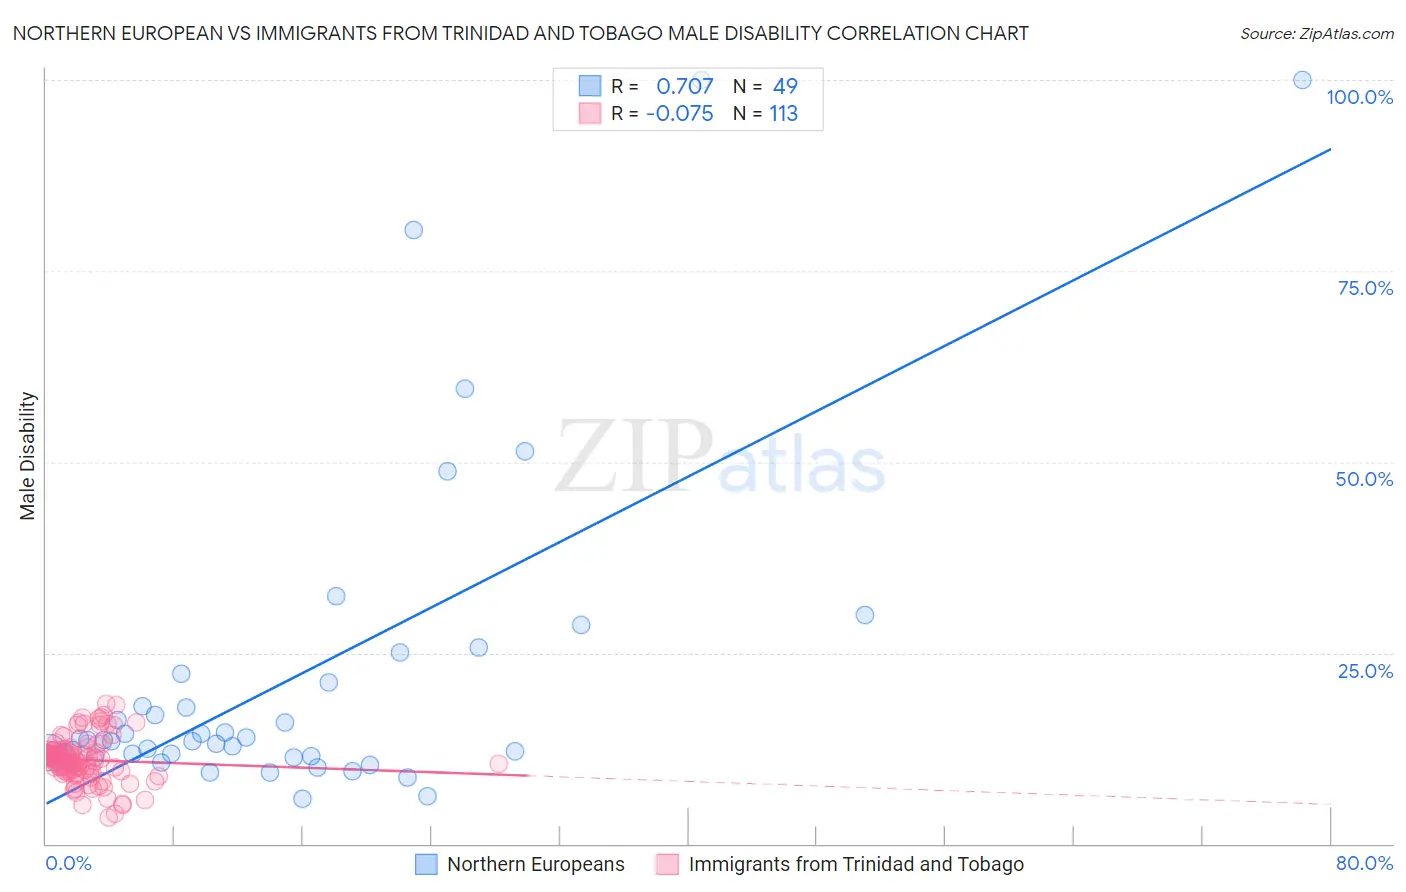
Northern European vs Immigrants from Trinidad and Tobago Male Disability Correlation Chart
The statistical analysis conducted on geographies consisting of 406,040,370 people shows a strong positive correlation between the proportion of Northern Europeans and percentage of males with a disability in the United States with a correlation coefficient (R) of 0.707 and weighted average of 11.9%. Similarly, the statistical analysis conducted on geographies consisting of 223,502,248 people shows a slight negative correlation between the proportion of Immigrants from Trinidad and Tobago and percentage of males with a disability in the United States with a correlation coefficient (R) of -0.075 and weighted average of 10.9%, a difference of 9.1%.
Male Disability Correlation Summary
| Measurement | Northern European | Immigrants from Trinidad and Tobago |
| Minimum | 5.8% | 3.4% |
| Maximum | 100.0% | 18.4% |
| Range | 94.2% | 14.9% |
| Mean | 21.8% | 11.0% |
| Median | 13.6% | 11.1% |
| Interquartile 25% (IQ1) | 11.5% | 9.5% |
| Interquartile 75% (IQ3) | 21.7% | 12.2% |
| Interquartile Range (IQR) | 10.3% | 2.7% |
| Standard Deviation (Sample) | 21.6% | 2.9% |
| Standard Deviation (Population) | 21.4% | 2.9% |
Similar Demographics by Male Disability
Demographics Similar to Northern Europeans by Male Disability
In terms of male disability, the demographic groups most similar to Northern Europeans are Bahamian (11.9%, a difference of 0.010%), Samoan (11.9%, a difference of 0.030%), Czech (11.9%, a difference of 0.050%), Italian (11.9%, a difference of 0.10%), and Immigrants from Laos (11.9%, a difference of 0.14%).
| Demographics | Rating | Rank | Male Disability |
| Immigrants | North America | 1.5 /100 | #235 | Tragic 11.9% |
| U.S. Virgin Islanders | 1.3 /100 | #236 | Tragic 11.9% |
| Carpatho Rusyns | 1.3 /100 | #237 | Tragic 11.9% |
| Yugoslavians | 1.2 /100 | #238 | Tragic 11.9% |
| Italians | 1.2 /100 | #239 | Tragic 11.9% |
| Czechs | 1.1 /100 | #240 | Tragic 11.9% |
| Bahamians | 1.1 /100 | #241 | Tragic 11.9% |
| Northern Europeans | 1.1 /100 | #242 | Tragic 11.9% |
| Samoans | 1.1 /100 | #243 | Tragic 11.9% |
| Immigrants | Laos | 1.0 /100 | #244 | Tragic 11.9% |
| Immigrants | Liberia | 1.0 /100 | #245 | Tragic 11.9% |
| Danes | 0.9 /100 | #246 | Tragic 11.9% |
| Hungarians | 0.8 /100 | #247 | Tragic 12.0% |
| Poles | 0.7 /100 | #248 | Tragic 12.0% |
| Immigrants | Yemen | 0.5 /100 | #249 | Tragic 12.0% |
Demographics Similar to Immigrants from Trinidad and Tobago by Male Disability
In terms of male disability, the demographic groups most similar to Immigrants from Trinidad and Tobago are Immigrants from Ukraine (10.9%, a difference of 0.010%), South American Indian (10.9%, a difference of 0.16%), Immigrants from North Macedonia (10.9%, a difference of 0.16%), Immigrants from Latvia (10.9%, a difference of 0.17%), and Immigrants from Philippines (10.9%, a difference of 0.17%).
| Demographics | Rating | Rank | Male Disability |
| Armenians | 90.1 /100 | #119 | Exceptional 10.9% |
| Immigrants | Africa | 89.4 /100 | #120 | Excellent 10.9% |
| Immigrants | South Eastern Asia | 89.2 /100 | #121 | Excellent 10.9% |
| Immigrants | Ghana | 89.0 /100 | #122 | Excellent 10.9% |
| Immigrants | Czechoslovakia | 88.4 /100 | #123 | Excellent 10.9% |
| South American Indians | 88.1 /100 | #124 | Excellent 10.9% |
| Immigrants | North Macedonia | 88.1 /100 | #125 | Excellent 10.9% |
| Immigrants | Trinidad and Tobago | 86.9 /100 | #126 | Excellent 10.9% |
| Immigrants | Ukraine | 86.8 /100 | #127 | Excellent 10.9% |
| Immigrants | Latvia | 85.5 /100 | #128 | Excellent 10.9% |
| Immigrants | Philippines | 85.4 /100 | #129 | Excellent 10.9% |
| Brazilians | 85.4 /100 | #130 | Excellent 10.9% |
| Macedonians | 84.2 /100 | #131 | Excellent 11.0% |
| Immigrants | Fiji | 84.0 /100 | #132 | Excellent 11.0% |
| Ugandans | 83.9 /100 | #133 | Excellent 11.0% |