Immigrants from Haiti vs Immigrants from Colombia Single Male Poverty
COMPARE
Immigrants from Haiti
Immigrants from Colombia
Single Male Poverty
Single Male Poverty Comparison
Immigrants from Haiti
Immigrants from Colombia
13.1%
SINGLE MALE POVERTY
16.8/ 100
METRIC RATING
210th/ 347
METRIC RANK
12.1%
SINGLE MALE POVERTY
98.6/ 100
METRIC RATING
82nd/ 347
METRIC RANK
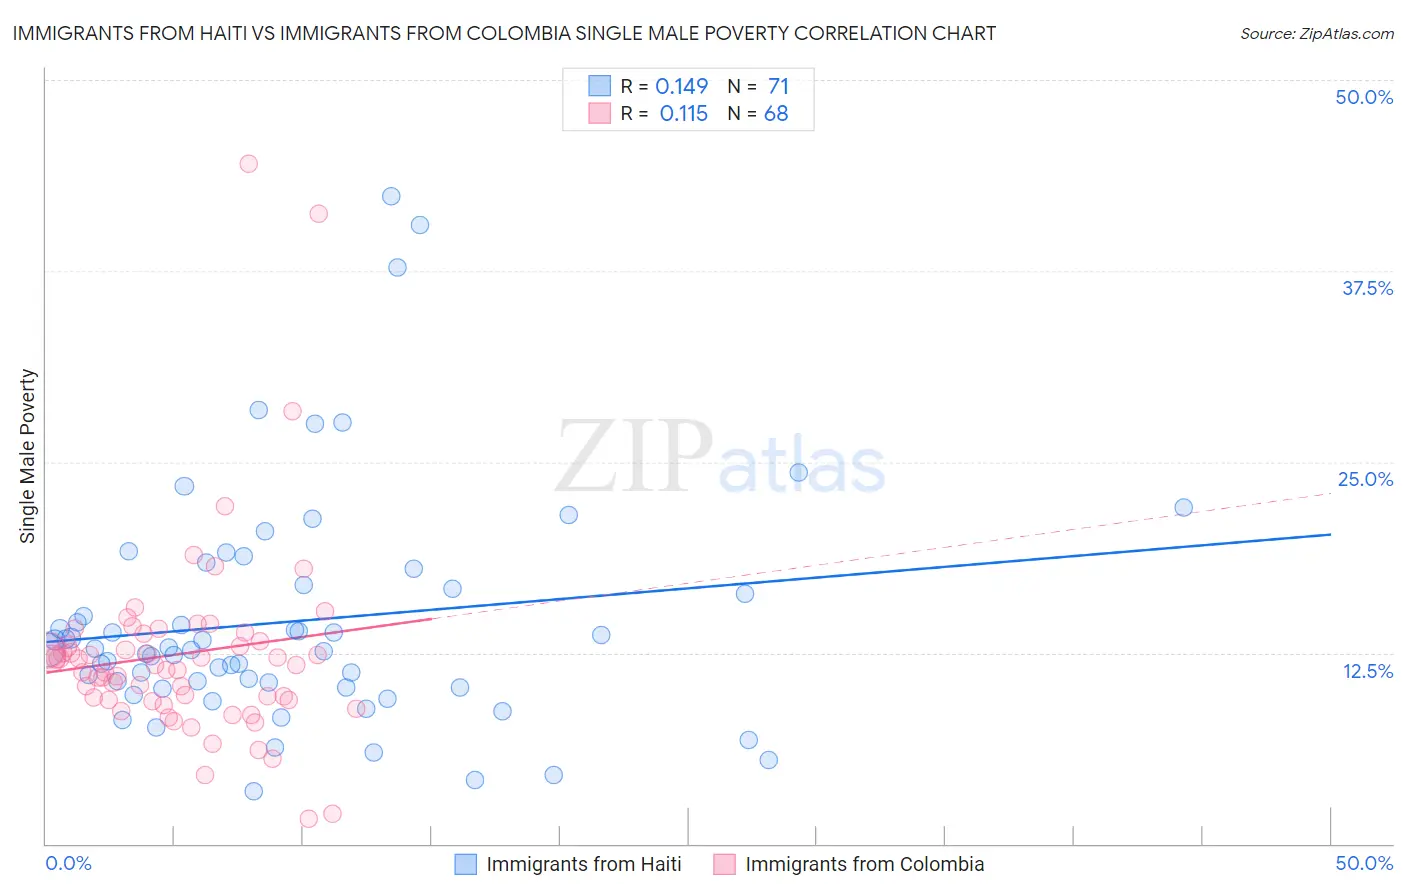
Immigrants from Haiti vs Immigrants from Colombia Single Male Poverty Correlation Chart
The statistical analysis conducted on geographies consisting of 207,631,435 people shows a poor positive correlation between the proportion of Immigrants from Haiti and poverty level among single males in the United States with a correlation coefficient (R) of 0.149 and weighted average of 13.1%. Similarly, the statistical analysis conducted on geographies consisting of 337,464,150 people shows a poor positive correlation between the proportion of Immigrants from Colombia and poverty level among single males in the United States with a correlation coefficient (R) of 0.115 and weighted average of 12.1%, a difference of 8.2%.
Single Male Poverty Correlation Summary
| Measurement | Immigrants from Haiti | Immigrants from Colombia |
| Minimum | 3.4% | 1.6% |
| Maximum | 42.4% | 44.5% |
| Range | 39.0% | 42.8% |
| Mean | 14.6% | 12.4% |
| Median | 12.7% | 11.7% |
| Interquartile 25% (IQ1) | 10.2% | 9.4% |
| Interquartile 75% (IQ3) | 17.0% | 13.5% |
| Interquartile Range (IQR) | 6.8% | 4.1% |
| Standard Deviation (Sample) | 7.7% | 6.7% |
| Standard Deviation (Population) | 7.6% | 6.6% |
Similar Demographics by Single Male Poverty
Demographics Similar to Immigrants from Haiti by Single Male Poverty
In terms of single male poverty, the demographic groups most similar to Immigrants from Haiti are Swedish (13.1%, a difference of 0.010%), Senegalese (13.1%, a difference of 0.040%), Mexican American Indian (13.1%, a difference of 0.060%), Immigrants from Western Africa (13.1%, a difference of 0.070%), and Sudanese (13.1%, a difference of 0.080%).
| Demographics | Rating | Rank | Single Male Poverty |
| Immigrants | Bangladesh | 20.4 /100 | #203 | Fair 13.0% |
| Estonians | 20.3 /100 | #204 | Fair 13.0% |
| Poles | 19.3 /100 | #205 | Poor 13.0% |
| Northern Europeans | 18.9 /100 | #206 | Poor 13.0% |
| Sudanese | 17.7 /100 | #207 | Poor 13.1% |
| Immigrants | Western Africa | 17.6 /100 | #208 | Poor 13.1% |
| Mexican American Indians | 17.5 /100 | #209 | Poor 13.1% |
| Immigrants | Haiti | 16.8 /100 | #210 | Poor 13.1% |
| Swedes | 16.8 /100 | #211 | Poor 13.1% |
| Senegalese | 16.4 /100 | #212 | Poor 13.1% |
| Italians | 15.9 /100 | #213 | Poor 13.1% |
| Zimbabweans | 14.9 /100 | #214 | Poor 13.1% |
| Japanese | 14.8 /100 | #215 | Poor 13.1% |
| Austrians | 13.9 /100 | #216 | Poor 13.1% |
| Bermudans | 13.0 /100 | #217 | Poor 13.1% |
Demographics Similar to Immigrants from Colombia by Single Male Poverty
In terms of single male poverty, the demographic groups most similar to Immigrants from Colombia are Immigrants from Chile (12.1%, a difference of 0.0%), Immigrants from Czechoslovakia (12.1%, a difference of 0.030%), Immigrants from South America (12.1%, a difference of 0.050%), Armenian (12.1%, a difference of 0.080%), and Turkish (12.1%, a difference of 0.10%).
| Demographics | Rating | Rank | Single Male Poverty |
| Uruguayans | 99.4 /100 | #75 | Exceptional 11.9% |
| Immigrants | Northern Africa | 99.4 /100 | #76 | Exceptional 11.9% |
| Immigrants | Malaysia | 99.2 /100 | #77 | Exceptional 12.0% |
| Immigrants | Venezuela | 99.1 /100 | #78 | Exceptional 12.0% |
| Immigrants | Belgium | 99.0 /100 | #79 | Exceptional 12.0% |
| Armenians | 98.7 /100 | #80 | Exceptional 12.1% |
| Immigrants | South America | 98.7 /100 | #81 | Exceptional 12.1% |
| Immigrants | Colombia | 98.6 /100 | #82 | Exceptional 12.1% |
| Immigrants | Chile | 98.6 /100 | #83 | Exceptional 12.1% |
| Immigrants | Czechoslovakia | 98.6 /100 | #84 | Exceptional 12.1% |
| Turks | 98.5 /100 | #85 | Exceptional 12.1% |
| Immigrants | Israel | 98.5 /100 | #86 | Exceptional 12.1% |
| South Americans | 98.5 /100 | #87 | Exceptional 12.1% |
| Immigrants | Eritrea | 98.5 /100 | #88 | Exceptional 12.1% |
| Immigrants | Ireland | 98.3 /100 | #89 | Exceptional 12.1% |