Immigrants from Guyana vs Slovak Unemployment Among Women with Children Under 6 years
COMPARE
Immigrants from Guyana
Slovak
Unemployment Among Women with Children Under 6 years
Unemployment Among Women with Children Under 6 years Comparison
Immigrants from Guyana
Slovaks
8.2%
UNEMPLOYMENT AMONG WOMEN WITH CHILDREN UNDER 6 YEARS
0.8/ 100
METRIC RATING
253rd/ 347
METRIC RANK
8.5%
UNEMPLOYMENT AMONG WOMEN WITH CHILDREN UNDER 6 YEARS
0.1/ 100
METRIC RATING
273rd/ 347
METRIC RANK
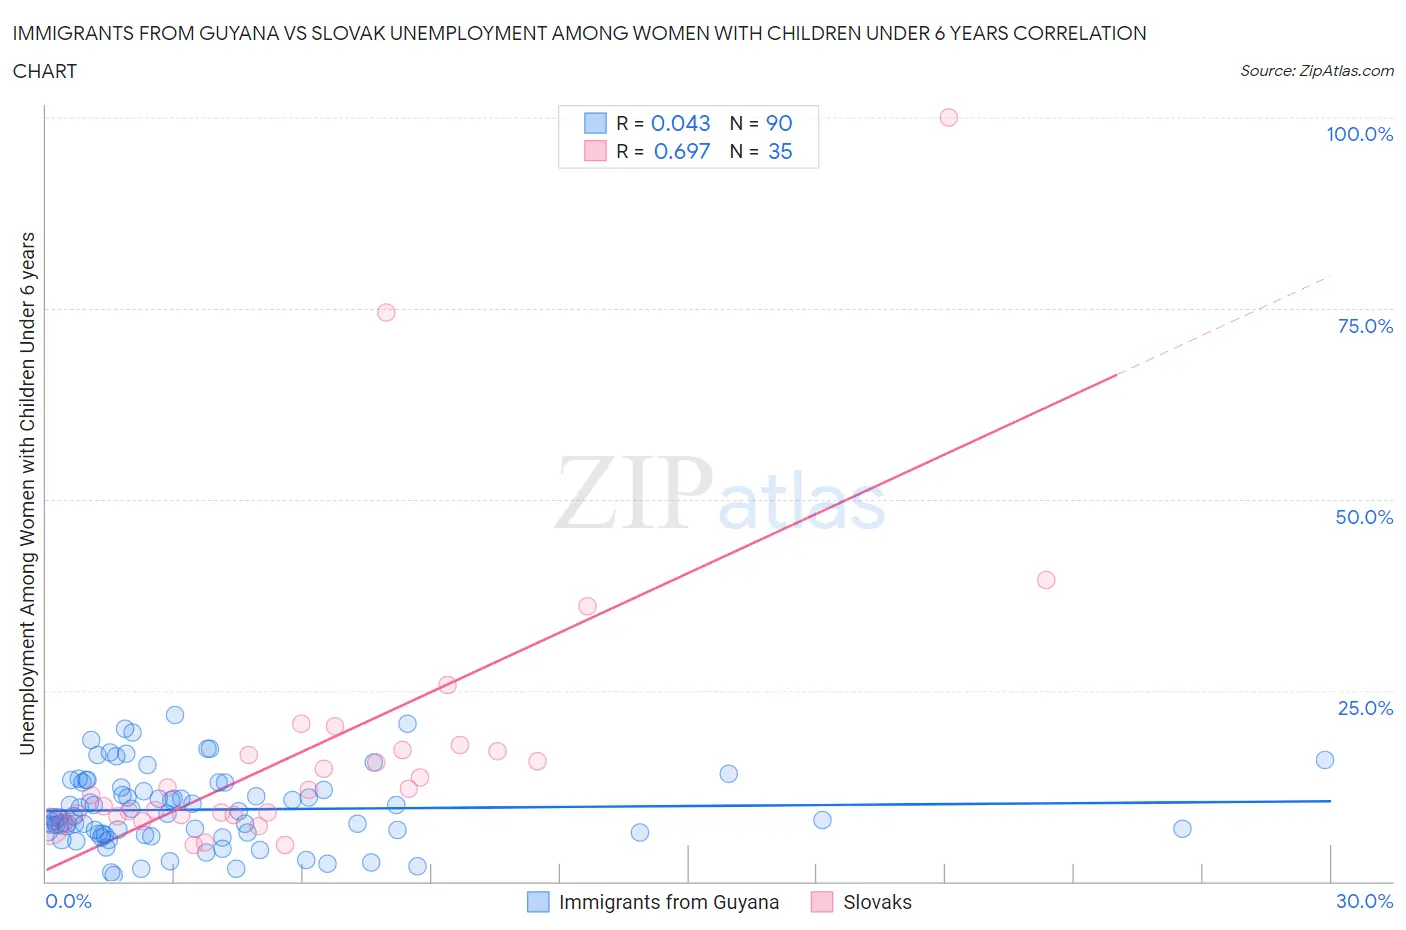
Immigrants from Guyana vs Slovak Unemployment Among Women with Children Under 6 years Correlation Chart
The statistical analysis conducted on geographies consisting of 155,055,932 people shows no correlation between the proportion of Immigrants from Guyana and unemployment rate among women with children under the age of 6 in the United States with a correlation coefficient (R) of 0.043 and weighted average of 8.2%. Similarly, the statistical analysis conducted on geographies consisting of 290,133,423 people shows a significant positive correlation between the proportion of Slovaks and unemployment rate among women with children under the age of 6 in the United States with a correlation coefficient (R) of 0.697 and weighted average of 8.5%, a difference of 3.3%.
Unemployment Among Women with Children Under 6 years Correlation Summary
| Measurement | Immigrants from Guyana | Slovak |
| Minimum | 0.77% | 4.8% |
| Maximum | 21.7% | 100.0% |
| Range | 20.9% | 95.2% |
| Mean | 9.4% | 17.7% |
| Median | 8.4% | 11.9% |
| Interquartile 25% (IQ1) | 6.2% | 8.6% |
| Interquartile 75% (IQ3) | 12.2% | 17.2% |
| Interquartile Range (IQR) | 6.0% | 8.5% |
| Standard Deviation (Sample) | 4.8% | 19.3% |
| Standard Deviation (Population) | 4.8% | 19.0% |
Demographics Similar to Immigrants from Guyana and Slovaks by Unemployment Among Women with Children Under 6 years
In terms of unemployment among women with children under 6 years, the demographic groups most similar to Immigrants from Guyana are Immigrants from Caribbean (8.3%, a difference of 0.27%), Immigrants from Portugal (8.3%, a difference of 0.56%), Celtic (8.3%, a difference of 0.57%), British West Indian (8.3%, a difference of 0.83%), and Immigrants from Ghana (8.3%, a difference of 0.86%). Similarly, the demographic groups most similar to Slovaks are Mexican American Indian (8.5%, a difference of 0.080%), Immigrants from Congo (8.5%, a difference of 0.64%), Immigrants from Senegal (8.5%, a difference of 0.65%), Immigrants from Haiti (8.4%, a difference of 0.99%), and Subsaharan African (8.4%, a difference of 1.1%).
| Demographics | Rating | Rank | Unemployment Among Women with Children Under 6 years |
| Immigrants | Guyana | 0.8 /100 | #253 | Tragic 8.2% |
| Immigrants | Caribbean | 0.7 /100 | #254 | Tragic 8.3% |
| Immigrants | Portugal | 0.6 /100 | #255 | Tragic 8.3% |
| Celtics | 0.6 /100 | #256 | Tragic 8.3% |
| British West Indians | 0.5 /100 | #257 | Tragic 8.3% |
| Immigrants | Ghana | 0.5 /100 | #258 | Tragic 8.3% |
| Barbadians | 0.4 /100 | #259 | Tragic 8.3% |
| Whites/Caucasians | 0.3 /100 | #260 | Tragic 8.4% |
| Immigrants | Liberia | 0.3 /100 | #261 | Tragic 8.4% |
| West Indians | 0.3 /100 | #262 | Tragic 8.4% |
| Scotch-Irish | 0.3 /100 | #263 | Tragic 8.4% |
| Hondurans | 0.3 /100 | #264 | Tragic 8.4% |
| French Canadians | 0.3 /100 | #265 | Tragic 8.4% |
| Immigrants | Honduras | 0.3 /100 | #266 | Tragic 8.4% |
| Belizeans | 0.2 /100 | #267 | Tragic 8.4% |
| Sub-Saharan Africans | 0.2 /100 | #268 | Tragic 8.4% |
| Immigrants | Haiti | 0.2 /100 | #269 | Tragic 8.4% |
| Immigrants | Senegal | 0.2 /100 | #270 | Tragic 8.5% |
| Immigrants | Congo | 0.2 /100 | #271 | Tragic 8.5% |
| Mexican American Indians | 0.1 /100 | #272 | Tragic 8.5% |
| Slovaks | 0.1 /100 | #273 | Tragic 8.5% |