Immigrants from Guyana vs Guatemalan Disability Age Under 5

COMPARE

Immigrants from Guyana
Race
Ancestry
AfghanAfricanAlaska NativeAlaskan AthabascanAlbanianAleutAlsatianAmericanApacheArabArapahoArgentineanArmenianAssyrian/Chaldean/SyriacAustralianAustrianBahamianBangladeshiBarbadianBasqueBelgianBelizeanBermudanBhutaneseBlackfeetBolivianBrazilianBritishBritish West IndianBulgarianBurmeseCajunCambodianCanadianCape VerdeanCarpatho RusynCelticCentral AmericanCentral American IndianCherokeeCheyenneChickasawChileanChineseChippewaChoctawColombianColvilleComancheCosta RicanCreeCreekCroatianCrowCubanCypriotCzechCzechoslovakianDanishDelawareDominicanDutchDutch West IndianEastern EuropeanEcuadorianEgyptianEnglishEstonianEthiopianEuropeanFijianFilipinoFinnishFrenchFrench American IndianFrench CanadianGermanGerman RussianGhanaianGreekGuamanian/ChamorroGuyaneseHaitianHmongHonduranHopiHoumaHungarianIcelanderIndian (Asian)IndonesianInupiatIranianIraqiIrishIroquoisIsraeliItalianJamaicanJapaneseJordanianKenyanKiowaKoreanLaotianLatvianLebaneseLiberianLithuanianLumbeeLuxembourgerMacedonianMalaysianMalteseMarshalleseMenomineeMexicanMexican American IndianMongolianMoroccanNative HawaiianNavajoNepaleseNew ZealanderNicaraguanNigerianNorthern EuropeanNorwegianOkinawanOsageOttawaPaiutePakistaniPalestinianPanamanianParaguayanPennsylvania GermanPeruvianPimaPolishPortuguesePotawatomiPuebloPuerto RicanPuget Sound SalishRomanianRussianSalvadoranSamoanScandinavianScotch-IrishScottishSeminoleSenegaleseSerbianShoshoneSierra LeoneanSiouxSlavicSlovakSloveneSomaliSouth AfricanSouth AmericanSouth American IndianSoviet UnionSpaniardSpanishSpanish AmericanSpanish American IndianSri LankanSubsaharan AfricanSudaneseSwedishSwissSyrianTaiwaneseThaiTlingit-HaidaTohono O'OdhamTonganTrinidadian and TobagonianTsimshianTurkishU.S. Virgin IslanderUgandanUkrainianUruguayanUteVenezuelanVietnameseWelshWest IndianYakamaYaquiYugoslavianYumanYup'ikZimbabwean
Immigration
NonimmigrantsImmigrantsAfghanistanAfricaAlbaniaArgentinaArmeniaAsiaAustraliaAustriaBahamasBangladeshBarbadosBelarusBelgiumBelizeBoliviaBosnia and HerzegovinaBrazilBulgariaBurma/MyanmarCabo VerdeCambodiaCameroonCanadaCaribbeanCentral AmericaChileChinaColombiaCongoCosta RicaCroatiaCubaCzechoslovakiaDenmarkDominicaDominican RepublicEastern AfricaEastern AsiaEastern EuropeEcuadorEgyptEl SalvadorEnglandEritreaEthiopiaEuropeFijiFranceGermanyGhanaGreeceGrenadaGuatemalaGuyanaHaitiHondurasHong KongHungaryIndiaIndonesiaIranIraqIrelandIsraelItalyJamaicaJapanJordanKazakhstanKenyaKoreaKuwaitLaosLatin AmericaLatviaLebanonLiberiaLithuaniaMalaysiaMexicoMicronesiaMiddle AfricaMoldovaMoroccoNepalNetherlandsNicaraguaNigeriaNorth AmericaNorth MacedoniaNorthern AfricaNorthern EuropeNorwayOceaniaPakistanPanamaPeruPhilippinesPolandPortugalRomaniaRussiaSaudi ArabiaScotlandSenegalSerbiaSierra LeoneSingaporeSomaliaSouth AfricaSouth AmericaSouth Central AsiaSouth Eastern AsiaSouthern EuropeSpainSri LankaSt. Vincent and the GrenadinesSudanSwedenSwitzerlandSyriaTaiwanThailandTrinidad and TobagoTurkeyUgandaUkraineUruguayUzbekistanVenezuelaVietnamWest IndiesWestern AfricaWestern AsiaWestern EuropeYemenZaireZimbabweAzores
Guatemalan
Race
Ancestry
AfghanAfricanAlaska NativeAlaskan AthabascanAlbanianAleutAlsatianAmericanApacheArabArapahoArgentineanArmenianAssyrian/Chaldean/SyriacAustralianAustrianBahamianBangladeshiBarbadianBasqueBelgianBelizeanBermudanBhutaneseBlackfeetBolivianBrazilianBritishBritish West IndianBulgarianBurmeseCajunCambodianCanadianCape VerdeanCarpatho RusynCelticCentral AmericanCentral American IndianCherokeeCheyenneChickasawChileanChineseChippewaChoctawColombianColvilleComancheCosta RicanCreeCreekCroatianCrowCubanCypriotCzechCzechoslovakianDanishDelawareDominicanDutchDutch West IndianEastern EuropeanEcuadorianEgyptianEnglishEstonianEthiopianEuropeanFijianFilipinoFinnishFrenchFrench American IndianFrench CanadianGermanGerman RussianGhanaianGreekGuamanian/ChamorroGuatemalanGuyaneseHaitianHmongHonduranHopiHoumaHungarianIcelanderIndian (Asian)IndonesianInupiatIranianIraqiIrishIroquoisIsraeliItalianJamaicanJapaneseJordanianKenyanKiowaKoreanLaotianLatvianLebaneseLiberianLithuanianLumbeeLuxembourgerMacedonianMalaysianMalteseMarshalleseMenomineeMexicanMexican American IndianMongolianMoroccanNative HawaiianNavajoNepaleseNew ZealanderNicaraguanNigerianNorthern EuropeanNorwegianOkinawanOsageOttawaPaiutePakistaniPalestinianPanamanianParaguayanPennsylvania GermanPeruvianPimaPolishPortuguesePotawatomiPuebloPuerto RicanPuget Sound SalishRomanianRussianSalvadoranSamoanScandinavianScotch-IrishScottishSeminoleSenegaleseSerbianShoshoneSierra LeoneanSiouxSlavicSlovakSloveneSomaliSouth AfricanSouth AmericanSouth American IndianSoviet UnionSpaniardSpanishSpanish AmericanSpanish American IndianSri LankanSubsaharan AfricanSudaneseSwedishSwissSyrianTaiwaneseThaiTlingit-HaidaTohono O'OdhamTonganTrinidadian and TobagonianTsimshianTurkishU.S. Virgin IslanderUgandanUkrainianUruguayanUteVenezuelanVietnameseWelshWest IndianYakamaYaquiYugoslavianYumanYup'ikZimbabwean
Immigration
NonimmigrantsImmigrantsAfghanistanAfricaAlbaniaArgentinaArmeniaAsiaAustraliaAustriaBahamasBangladeshBarbadosBelarusBelgiumBelizeBoliviaBosnia and HerzegovinaBrazilBulgariaBurma/MyanmarCabo VerdeCambodiaCameroonCanadaCaribbeanCentral AmericaChileChinaColombiaCongoCosta RicaCroatiaCubaCzechoslovakiaDenmarkDominicaDominican RepublicEastern AfricaEastern AsiaEastern EuropeEcuadorEgyptEl SalvadorEnglandEritreaEthiopiaEuropeFijiFranceGermanyGhanaGreeceGrenadaGuatemalaHaitiHondurasHong KongHungaryIndiaIndonesiaIranIraqIrelandIsraelItalyJamaicaJapanJordanKazakhstanKenyaKoreaKuwaitLaosLatin AmericaLatviaLebanonLiberiaLithuaniaMalaysiaMexicoMicronesiaMiddle AfricaMoldovaMoroccoNepalNetherlandsNicaraguaNigeriaNorth AmericaNorth MacedoniaNorthern AfricaNorthern EuropeNorwayOceaniaPakistanPanamaPeruPhilippinesPolandPortugalRomaniaRussiaSaudi ArabiaScotlandSenegalSerbiaSierra LeoneSingaporeSomaliaSouth AfricaSouth AmericaSouth Central AsiaSouth Eastern AsiaSouthern EuropeSpainSri LankaSt. Vincent and the GrenadinesSudanSwedenSwitzerlandSyriaTaiwanThailandTrinidad and TobagoTurkeyUgandaUkraineUruguayUzbekistanVenezuelaVietnamWest IndiesWestern AfricaWestern AsiaWestern EuropeYemenZaireZimbabweAzores
Disability Age Under 5
Income
Poverty
Unemployment
Labor Participation
Family Structure
Vehicle Availability
Education Level
Disability

Disability Age Under 5 Comparison

Immigrants from Guyana

Guatemalans

Exceptional
Good
1.0%
DISABILITY AGE UNDER 5
99.9/ 100
METRIC RATING
38th/ 347
METRIC RANK
1.2%
DISABILITY AGE UNDER 5
63.6/ 100
METRIC RATING
162nd/ 347
METRIC RANK

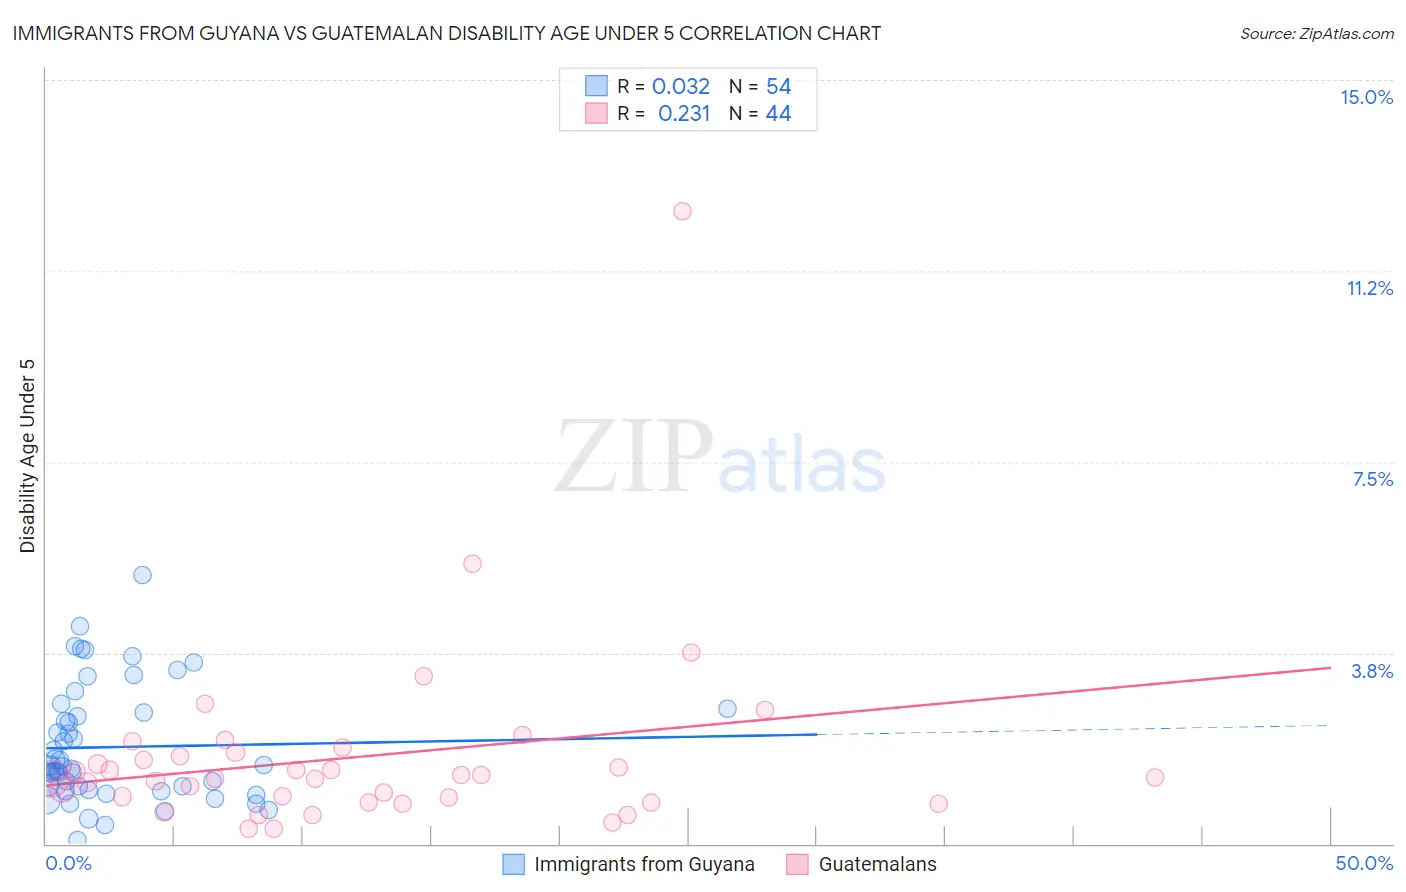
Immigrants from Guyana vs Guatemalan Disability Age Under 5 Correlation Chart

The statistical analysis conducted on geographies consisting of 116,239,844 people shows no correlation between the proportion of Immigrants from Guyana and percentage of population with a disability under the age of 5 in the United States with a correlation coefficient (R) of 0.032 and weighted average of 1.0%. Similarly, the statistical analysis conducted on geographies consisting of 225,218,414 people shows a weak positive correlation between the proportion of Guatemalans and percentage of population with a disability under the age of 5 in the United States with a correlation coefficient (R) of 0.231 and weighted average of 1.2%, a difference of 17.1%.
Immigrants from Guyana vs Guatemalan Disability Age Under 5

Disability Age Under 5 Correlation Summary

MeasurementImmigrants from GuyanaGuatemalan
Minimum0.063%0.29%
Maximum5.3%12.4%
Range5.2%12.1%
Mean1.9%1.7%
Median1.5%1.3%
Interquartile 25% (IQ1)1.1%0.86%
Interquartile 75% (IQ3)2.6%1.8%
Interquartile Range (IQR)1.5%0.90%
Standard Deviation (Sample)1.1%1.9%
Standard Deviation (Population)1.1%1.9%

Similar Demographics by Disability Age Under 5

Demographics Similar to Immigrants from Guyana by Disability Age Under 5

In terms of disability age under 5, the demographic groups most similar to Immigrants from Guyana are Immigrants from India (1.0%, a difference of 0.080%), Immigrants from Nepal (1.0%, a difference of 0.11%), Filipino (1.1%, a difference of 0.67%), Barbadian (1.0%, a difference of 0.82%), and Immigrants from Albania (1.1%, a difference of 1.0%).
DemographicsRating | RankDisability Age Under 5
Armenians
99.9
/100
|
#31
Exceptional
1.0%
Iranians
99.9
/100
|
#32
Exceptional
1.0%
Bolivians
99.9
/100
|
#33
Exceptional
1.0%
Immigrants | Ukraine
99.9
/100
|
#34
Exceptional
1.0%
Barbadians
99.9
/100
|
#35
Exceptional
1.0%
Immigrants | Nepal
99.9
/100
|
#36
Exceptional
1.0%
Immigrants | India
99.9
/100
|
#37
Exceptional
1.0%
Immigrants | Guyana
99.9
/100
|
#38
Exceptional
1.0%
Filipinos
99.9
/100
|
#39
Exceptional
1.1%
Immigrants | Albania
99.9
/100
|
#40
Exceptional
1.1%
Thais
99.8
/100
|
#41
Exceptional
1.1%
Immigrants | Bulgaria
99.8
/100
|
#42
Exceptional
1.1%
Pima
99.8
/100
|
#43
Exceptional
1.1%
Immigrants | Asia
99.8
/100
|
#44
Exceptional
1.1%
Immigrants | Turkey
99.8
/100
|
#45
Exceptional
1.1%

Demographics Similar to Guatemalans by Disability Age Under 5

In terms of disability age under 5, the demographic groups most similar to Guatemalans are Immigrants from Guatemala (1.2%, a difference of 0.030%), Laotian (1.2%, a difference of 0.080%), Immigrants from Kuwait (1.2%, a difference of 0.10%), Immigrants from Africa (1.2%, a difference of 0.15%), and Immigrants from Central America (1.2%, a difference of 0.21%).
DemographicsRating | RankDisability Age Under 5
Immigrants | Ghana
68.7
/100
|
#155
Good
1.2%
Hawaiians
68.5
/100
|
#156
Good
1.2%
Immigrants | South America
67.0
/100
|
#157
Good
1.2%
Arabs
66.4
/100
|
#158
Good
1.2%
Colombians
65.8
/100
|
#159
Good
1.2%
Immigrants | Latin America
65.8
/100
|
#160
Good
1.2%
Immigrants | Africa
65.1
/100
|
#161
Good
1.2%
Guatemalans
63.6
/100
|
#162
Good
1.2%
Immigrants | Guatemala
63.2
/100
|
#163
Good
1.2%
Laotians
62.8
/100
|
#164
Good
1.2%
Immigrants | Kuwait
62.6
/100
|
#165
Good
1.2%
Immigrants | Central America
61.4
/100
|
#166
Good
1.2%
Immigrants | Argentina
60.2
/100
|
#167
Good
1.2%
Sierra Leoneans
59.1
/100
|
#168
Average
1.2%
Immigrants | Uruguay
59.0
/100
|
#169
Average
1.2%