Immigrants from Guyana vs Immigrants from Germany Disability Age Under 5
COMPARE
Immigrants from Guyana
Immigrants from Germany
Disability Age Under 5
Disability Age Under 5 Comparison
Immigrants from Guyana
Immigrants from Germany
1.0%
DISABILITY AGE UNDER 5
99.9/ 100
METRIC RATING
38th/ 347
METRIC RANK
1.4%
DISABILITY AGE UNDER 5
0.1/ 100
METRIC RATING
266th/ 347
METRIC RANK
Immigrants from Guyana vs Immigrants from Germany Disability Age Under 5 Correlation Chart
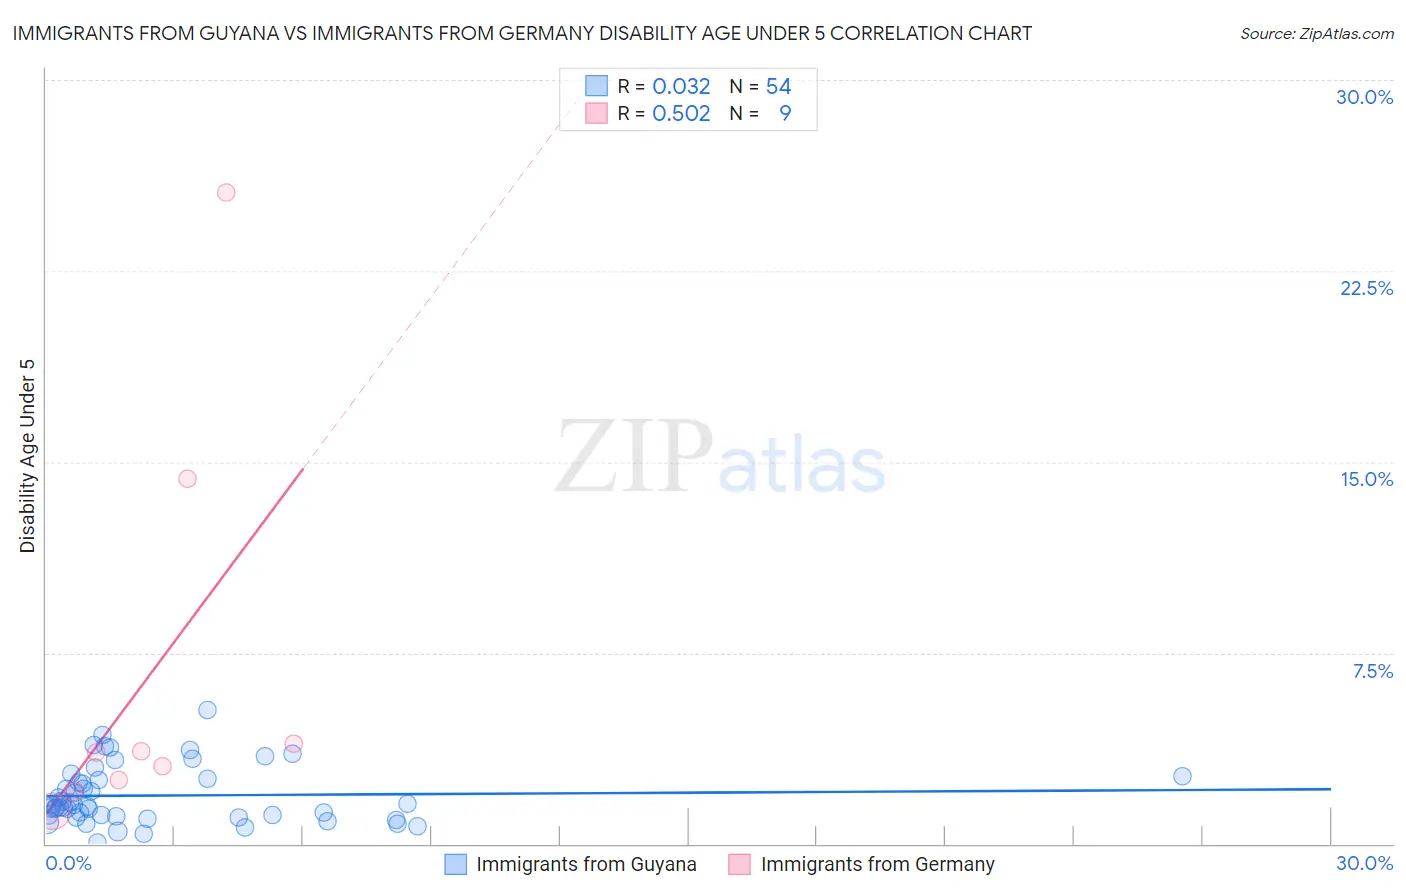
The statistical analysis conducted on geographies consisting of 116,239,844 people shows no correlation between the proportion of Immigrants from Guyana and percentage of population with a disability under the age of 5 in the United States with a correlation coefficient (R) of 0.032 and weighted average of 1.0%. Similarly, the statistical analysis conducted on geographies consisting of 235,379,937 people shows a substantial positive correlation between the proportion of Immigrants from Germany and percentage of population with a disability under the age of 5 in the United States with a correlation coefficient (R) of 0.502 and weighted average of 1.4%, a difference of 36.2%.
Disability Age Under 5 Correlation Summary
| Measurement | Immigrants from Guyana | Immigrants from Germany |
| Minimum | 0.063% | 1.3% |
| Maximum | 5.3% | 25.6% |
| Range | 5.2% | 24.3% |
| Mean | 1.9% | 6.7% |
| Median | 1.5% | 3.6% |
| Interquartile 25% (IQ1) | 1.1% | 2.3% |
| Interquartile 75% (IQ3) | 2.6% | 9.1% |
| Interquartile Range (IQR) | 1.5% | 6.8% |
| Standard Deviation (Sample) | 1.1% | 8.1% |
| Standard Deviation (Population) | 1.1% | 7.6% |
Similar Demographics by Disability Age Under 5
Demographics Similar to Immigrants from Guyana by Disability Age Under 5
In terms of disability age under 5, the demographic groups most similar to Immigrants from Guyana are Immigrants from India (1.0%, a difference of 0.080%), Immigrants from Nepal (1.0%, a difference of 0.11%), Filipino (1.1%, a difference of 0.67%), Barbadian (1.0%, a difference of 0.82%), and Immigrants from Albania (1.1%, a difference of 1.0%).
| Demographics | Rating | Rank | Disability Age Under 5 |
| Armenians | 99.9 /100 | #31 | Exceptional 1.0% |
| Iranians | 99.9 /100 | #32 | Exceptional 1.0% |
| Bolivians | 99.9 /100 | #33 | Exceptional 1.0% |
| Immigrants | Ukraine | 99.9 /100 | #34 | Exceptional 1.0% |
| Barbadians | 99.9 /100 | #35 | Exceptional 1.0% |
| Immigrants | Nepal | 99.9 /100 | #36 | Exceptional 1.0% |
| Immigrants | India | 99.9 /100 | #37 | Exceptional 1.0% |
| Immigrants | Guyana | 99.9 /100 | #38 | Exceptional 1.0% |
| Filipinos | 99.9 /100 | #39 | Exceptional 1.1% |
| Immigrants | Albania | 99.9 /100 | #40 | Exceptional 1.1% |
| Thais | 99.8 /100 | #41 | Exceptional 1.1% |
| Immigrants | Bulgaria | 99.8 /100 | #42 | Exceptional 1.1% |
| Pima | 99.8 /100 | #43 | Exceptional 1.1% |
| Immigrants | Asia | 99.8 /100 | #44 | Exceptional 1.1% |
| Immigrants | Turkey | 99.8 /100 | #45 | Exceptional 1.1% |
Demographics Similar to Immigrants from Germany by Disability Age Under 5
In terms of disability age under 5, the demographic groups most similar to Immigrants from Germany are Carpatho Rusyn (1.4%, a difference of 0.030%), Yugoslavian (1.4%, a difference of 0.080%), Spanish (1.4%, a difference of 0.22%), Immigrants from Dominica (1.4%, a difference of 0.28%), and Immigrants from Netherlands (1.4%, a difference of 0.44%).
| Demographics | Rating | Rank | Disability Age Under 5 |
| Immigrants | Southern Europe | 0.3 /100 | #259 | Tragic 1.4% |
| Slavs | 0.3 /100 | #260 | Tragic 1.4% |
| Immigrants | Netherlands | 0.2 /100 | #261 | Tragic 1.4% |
| Immigrants | Dominica | 0.2 /100 | #262 | Tragic 1.4% |
| Spanish | 0.2 /100 | #263 | Tragic 1.4% |
| Yugoslavians | 0.1 /100 | #264 | Tragic 1.4% |
| Carpatho Rusyns | 0.1 /100 | #265 | Tragic 1.4% |
| Immigrants | Germany | 0.1 /100 | #266 | Tragic 1.4% |
| Cree | 0.1 /100 | #267 | Tragic 1.4% |
| Belgians | 0.1 /100 | #268 | Tragic 1.4% |
| Austrians | 0.1 /100 | #269 | Tragic 1.4% |
| Immigrants | North America | 0.1 /100 | #270 | Tragic 1.4% |
| Immigrants | Canada | 0.1 /100 | #271 | Tragic 1.4% |
| Blacks/African Americans | 0.1 /100 | #272 | Tragic 1.4% |
| Alaskan Athabascans | 0.1 /100 | #273 | Tragic 1.5% |