Immigrants from Guyana vs Guatemalan Unemployment Among Ages 25 to 29 years
COMPARE
Immigrants from Guyana
Guatemalan
Unemployment Among Ages 25 to 29 years
Unemployment Among Ages 25 to 29 years Comparison
Immigrants from Guyana
Guatemalans
8.5%
UNEMPLOYMENT AMONG AGES 25 TO 29 YEARS
0.0/ 100
METRIC RATING
317th/ 347
METRIC RANK
7.1%
UNEMPLOYMENT AMONG AGES 25 TO 29 YEARS
0.9/ 100
METRIC RATING
245th/ 347
METRIC RANK
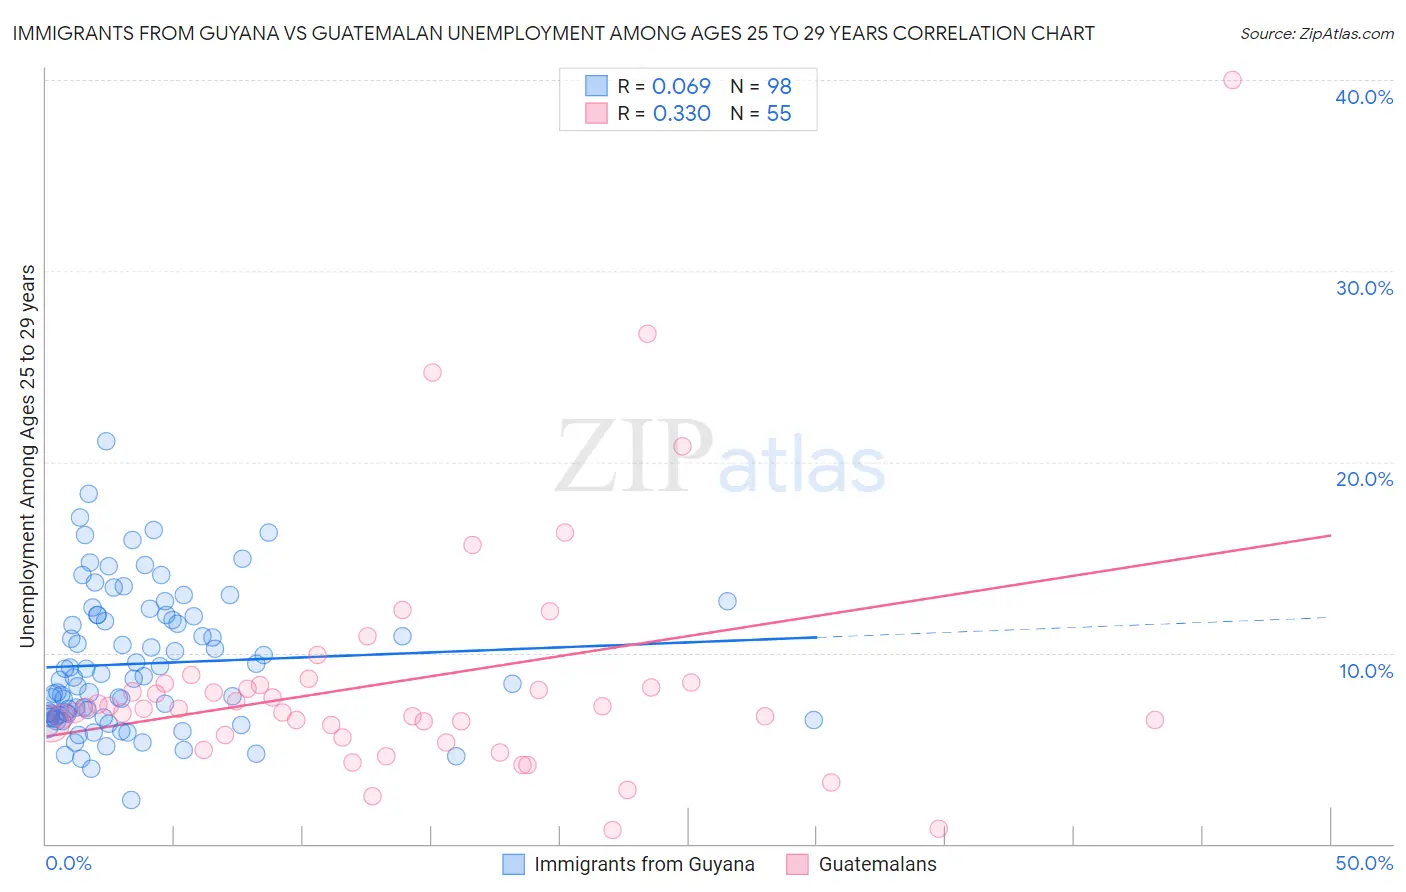
Immigrants from Guyana vs Guatemalan Unemployment Among Ages 25 to 29 years Correlation Chart
The statistical analysis conducted on geographies consisting of 179,255,747 people shows a slight positive correlation between the proportion of Immigrants from Guyana and unemployment rate among population between the ages 25 and 29 in the United States with a correlation coefficient (R) of 0.069 and weighted average of 8.5%. Similarly, the statistical analysis conducted on geographies consisting of 390,290,903 people shows a mild positive correlation between the proportion of Guatemalans and unemployment rate among population between the ages 25 and 29 in the United States with a correlation coefficient (R) of 0.330 and weighted average of 7.1%, a difference of 18.6%.
Unemployment Among Ages 25 to 29 years Correlation Summary
| Measurement | Immigrants from Guyana | Guatemalan |
| Minimum | 2.3% | 0.70% |
| Maximum | 21.1% | 40.0% |
| Range | 18.8% | 39.3% |
| Mean | 9.4% | 8.6% |
| Median | 8.7% | 7.1% |
| Interquartile 25% (IQ1) | 6.6% | 5.7% |
| Interquartile 75% (IQ3) | 12.0% | 8.4% |
| Interquartile Range (IQR) | 5.3% | 2.7% |
| Standard Deviation (Sample) | 3.6% | 6.5% |
| Standard Deviation (Population) | 3.6% | 6.4% |
Similar Demographics by Unemployment Among Ages 25 to 29 years
Demographics Similar to Immigrants from Guyana by Unemployment Among Ages 25 to 29 years
In terms of unemployment among ages 25 to 29 years, the demographic groups most similar to Immigrants from Guyana are Immigrants from Grenada (8.4%, a difference of 0.090%), British West Indian (8.4%, a difference of 0.15%), Guyanese (8.5%, a difference of 0.26%), Immigrants from Armenia (8.5%, a difference of 0.48%), and Immigrants from Dominica (8.4%, a difference of 0.75%).
| Demographics | Rating | Rank | Unemployment Among Ages 25 to 29 years |
| U.S. Virgin Islanders | 0.0 /100 | #310 | Tragic 8.1% |
| Immigrants | Azores | 0.0 /100 | #311 | Tragic 8.1% |
| Dutch West Indians | 0.0 /100 | #312 | Tragic 8.2% |
| Immigrants | St. Vincent and the Grenadines | 0.0 /100 | #313 | Tragic 8.4% |
| Immigrants | Dominica | 0.0 /100 | #314 | Tragic 8.4% |
| British West Indians | 0.0 /100 | #315 | Tragic 8.4% |
| Immigrants | Grenada | 0.0 /100 | #316 | Tragic 8.4% |
| Immigrants | Guyana | 0.0 /100 | #317 | Tragic 8.5% |
| Guyanese | 0.0 /100 | #318 | Tragic 8.5% |
| Immigrants | Armenia | 0.0 /100 | #319 | Tragic 8.5% |
| Blacks/African Americans | 0.0 /100 | #320 | Tragic 8.6% |
| Immigrants | Dominican Republic | 0.0 /100 | #321 | Tragic 8.6% |
| Tlingit-Haida | 0.0 /100 | #322 | Tragic 8.7% |
| Dominicans | 0.0 /100 | #323 | Tragic 8.7% |
| Houma | 0.0 /100 | #324 | Tragic 8.7% |
Demographics Similar to Guatemalans by Unemployment Among Ages 25 to 29 years
In terms of unemployment among ages 25 to 29 years, the demographic groups most similar to Guatemalans are Nonimmigrants (7.1%, a difference of 0.10%), Yaqui (7.1%, a difference of 0.13%), Spanish American Indian (7.1%, a difference of 0.26%), Immigrants from Uzbekistan (7.2%, a difference of 0.40%), and Immigrants from Guatemala (7.2%, a difference of 0.41%).
| Demographics | Rating | Rank | Unemployment Among Ages 25 to 29 years |
| Hondurans | 1.8 /100 | #238 | Tragic 7.1% |
| Potawatomi | 1.3 /100 | #239 | Tragic 7.1% |
| Native Hawaiians | 1.3 /100 | #240 | Tragic 7.1% |
| Immigrants | Sierra Leone | 1.3 /100 | #241 | Tragic 7.1% |
| Spanish American Indians | 1.1 /100 | #242 | Tragic 7.1% |
| Yaqui | 1.0 /100 | #243 | Tragic 7.1% |
| Immigrants | Nonimmigrants | 0.9 /100 | #244 | Tragic 7.1% |
| Guatemalans | 0.9 /100 | #245 | Tragic 7.1% |
| Immigrants | Uzbekistan | 0.7 /100 | #246 | Tragic 7.2% |
| Immigrants | Guatemala | 0.7 /100 | #247 | Tragic 7.2% |
| Sub-Saharan Africans | 0.6 /100 | #248 | Tragic 7.2% |
| Seminole | 0.6 /100 | #249 | Tragic 7.2% |
| Delaware | 0.5 /100 | #250 | Tragic 7.2% |
| Portuguese | 0.5 /100 | #251 | Tragic 7.2% |
| Sierra Leoneans | 0.4 /100 | #252 | Tragic 7.2% |