Ottawa vs Guatemalan Disability Age Under 5
COMPARE
Ottawa
Guatemalan
Disability Age Under 5
Disability Age Under 5 Comparison
Ottawa
Guatemalans
1.7%
DISABILITY AGE UNDER 5
0.0/ 100
METRIC RATING
321st/ 347
METRIC RANK
1.2%
DISABILITY AGE UNDER 5
63.6/ 100
METRIC RATING
162nd/ 347
METRIC RANK
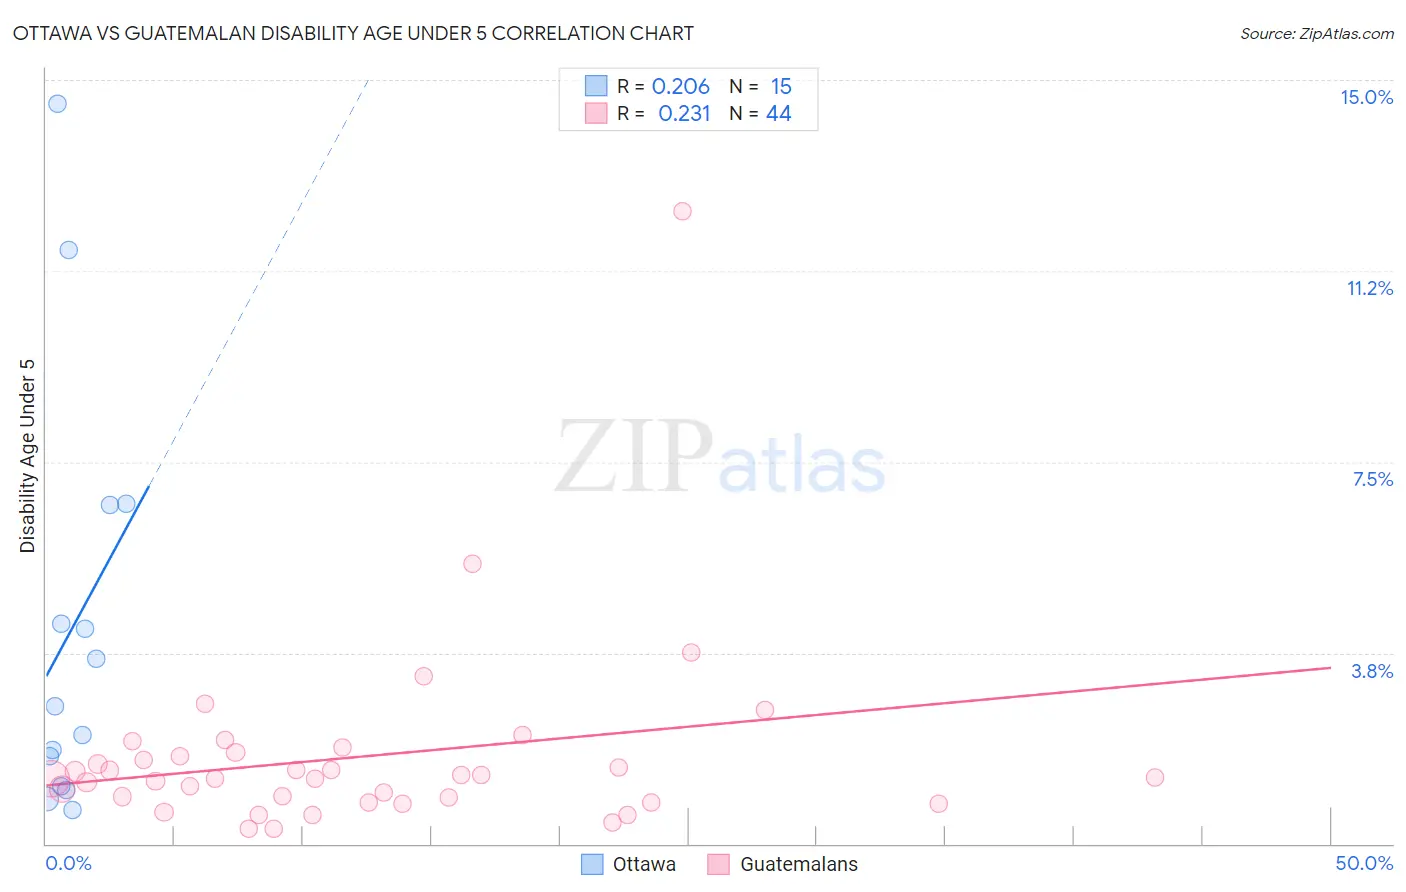
Ottawa vs Guatemalan Disability Age Under 5 Correlation Chart
The statistical analysis conducted on geographies consisting of 39,604,340 people shows a weak positive correlation between the proportion of Ottawa and percentage of population with a disability under the age of 5 in the United States with a correlation coefficient (R) of 0.206 and weighted average of 1.7%. Similarly, the statistical analysis conducted on geographies consisting of 225,218,414 people shows a weak positive correlation between the proportion of Guatemalans and percentage of population with a disability under the age of 5 in the United States with a correlation coefficient (R) of 0.231 and weighted average of 1.2%, a difference of 39.7%.
Disability Age Under 5 Correlation Summary
| Measurement | Ottawa | Guatemalan |
| Minimum | 0.66% | 0.29% |
| Maximum | 14.5% | 12.4% |
| Range | 13.9% | 12.1% |
| Mean | 4.3% | 1.7% |
| Median | 2.7% | 1.3% |
| Interquartile 25% (IQ1) | 1.1% | 0.86% |
| Interquartile 75% (IQ3) | 6.6% | 1.8% |
| Interquartile Range (IQR) | 5.5% | 0.90% |
| Standard Deviation (Sample) | 4.1% | 1.9% |
| Standard Deviation (Population) | 4.0% | 1.9% |
Similar Demographics by Disability Age Under 5
Demographics Similar to Ottawa by Disability Age Under 5
In terms of disability age under 5, the demographic groups most similar to Ottawa are Scotch-Irish (1.7%, a difference of 0.060%), German (1.7%, a difference of 0.57%), Slovak (1.7%, a difference of 0.59%), Irish (1.7%, a difference of 0.89%), and French (1.7%, a difference of 1.2%).
| Demographics | Rating | Rank | Disability Age Under 5 |
| Norwegians | 0.0 /100 | #314 | Tragic 1.7% |
| Dutch | 0.0 /100 | #315 | Tragic 1.7% |
| Immigrants | Cabo Verde | 0.0 /100 | #316 | Tragic 1.7% |
| French | 0.0 /100 | #317 | Tragic 1.7% |
| Irish | 0.0 /100 | #318 | Tragic 1.7% |
| Slovaks | 0.0 /100 | #319 | Tragic 1.7% |
| Scotch-Irish | 0.0 /100 | #320 | Tragic 1.7% |
| Ottawa | 0.0 /100 | #321 | Tragic 1.7% |
| Germans | 0.0 /100 | #322 | Tragic 1.7% |
| Chickasaw | 0.0 /100 | #323 | Tragic 1.7% |
| Cherokee | 0.0 /100 | #324 | Tragic 1.8% |
| Immigrants | Portugal | 0.0 /100 | #325 | Tragic 1.8% |
| Sioux | 0.0 /100 | #326 | Tragic 1.8% |
| Osage | 0.0 /100 | #327 | Tragic 1.8% |
| Americans | 0.0 /100 | #328 | Tragic 1.9% |
Demographics Similar to Guatemalans by Disability Age Under 5
In terms of disability age under 5, the demographic groups most similar to Guatemalans are Immigrants from Guatemala (1.2%, a difference of 0.030%), Laotian (1.2%, a difference of 0.080%), Immigrants from Kuwait (1.2%, a difference of 0.10%), Immigrants from Africa (1.2%, a difference of 0.15%), and Immigrants from Central America (1.2%, a difference of 0.21%).
| Demographics | Rating | Rank | Disability Age Under 5 |
| Immigrants | Ghana | 68.7 /100 | #155 | Good 1.2% |
| Hawaiians | 68.5 /100 | #156 | Good 1.2% |
| Immigrants | South America | 67.0 /100 | #157 | Good 1.2% |
| Arabs | 66.4 /100 | #158 | Good 1.2% |
| Colombians | 65.8 /100 | #159 | Good 1.2% |
| Immigrants | Latin America | 65.8 /100 | #160 | Good 1.2% |
| Immigrants | Africa | 65.1 /100 | #161 | Good 1.2% |
| Guatemalans | 63.6 /100 | #162 | Good 1.2% |
| Immigrants | Guatemala | 63.2 /100 | #163 | Good 1.2% |
| Laotians | 62.8 /100 | #164 | Good 1.2% |
| Immigrants | Kuwait | 62.6 /100 | #165 | Good 1.2% |
| Immigrants | Central America | 61.4 /100 | #166 | Good 1.2% |
| Immigrants | Argentina | 60.2 /100 | #167 | Good 1.2% |
| Sierra Leoneans | 59.1 /100 | #168 | Average 1.2% |
| Immigrants | Uruguay | 59.0 /100 | #169 | Average 1.2% |