Immigrants from Guatemala vs Jamaican Self-Care Disability
COMPARE
Immigrants from Guatemala
Jamaican
Self-Care Disability
Self-Care Disability Comparison
Immigrants from Guatemala
Jamaicans
2.6%
SELF-CARE DISABILITY
2.2/ 100
METRIC RATING
231st/ 347
METRIC RANK
2.7%
SELF-CARE DISABILITY
0.0/ 100
METRIC RATING
285th/ 347
METRIC RANK
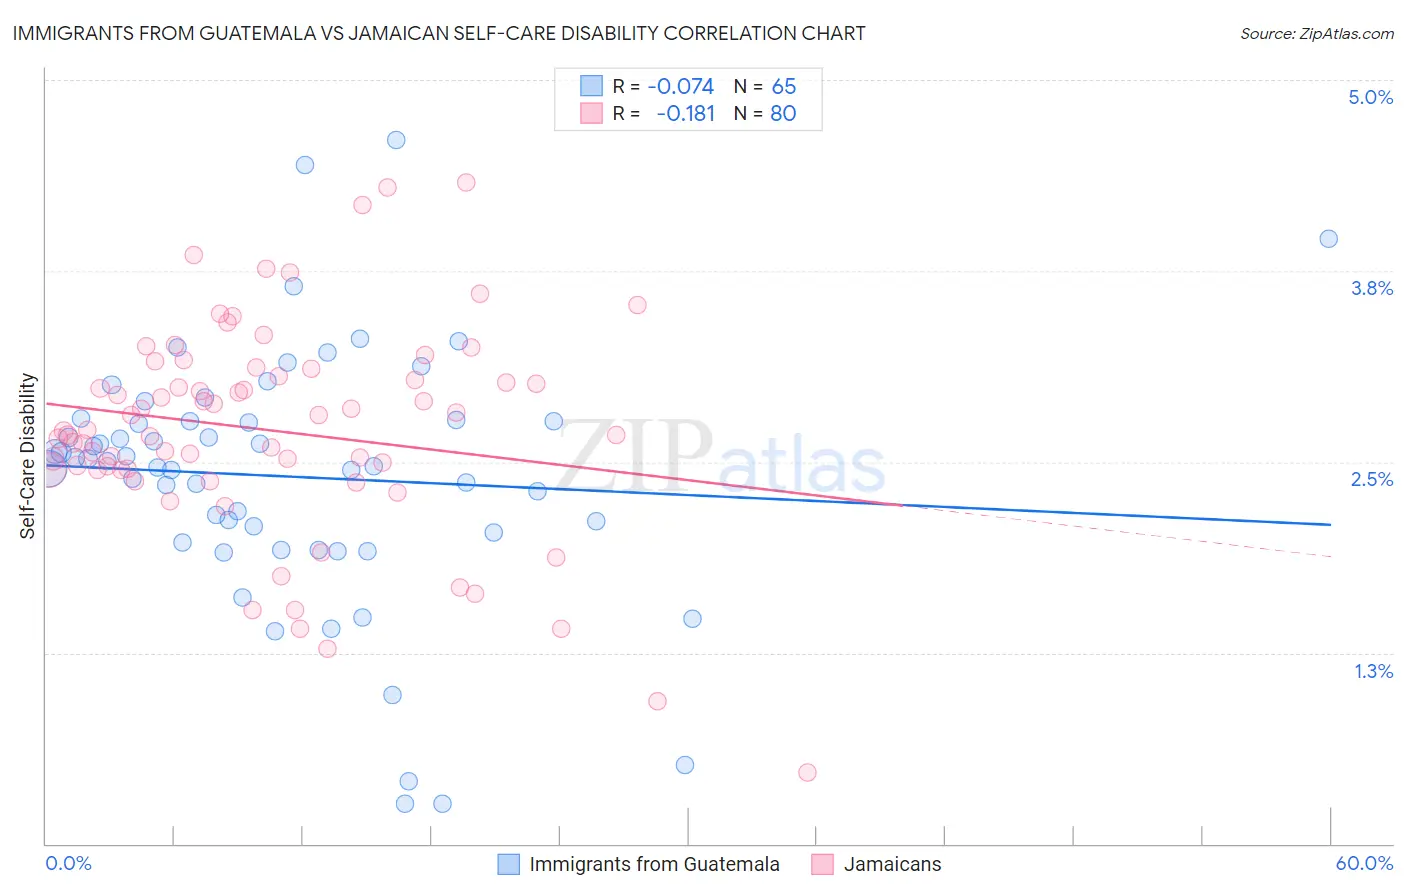
Immigrants from Guatemala vs Jamaican Self-Care Disability Correlation Chart
The statistical analysis conducted on geographies consisting of 376,972,339 people shows a slight negative correlation between the proportion of Immigrants from Guatemala and percentage of population with self-care disability in the United States with a correlation coefficient (R) of -0.074 and weighted average of 2.6%. Similarly, the statistical analysis conducted on geographies consisting of 367,399,867 people shows a poor negative correlation between the proportion of Jamaicans and percentage of population with self-care disability in the United States with a correlation coefficient (R) of -0.181 and weighted average of 2.7%, a difference of 4.6%.
Self-Care Disability Correlation Summary
| Measurement | Immigrants from Guatemala | Jamaican |
| Minimum | 0.26% | 0.47% |
| Maximum | 4.6% | 4.3% |
| Range | 4.3% | 3.9% |
| Mean | 2.4% | 2.7% |
| Median | 2.5% | 2.7% |
| Interquartile 25% (IQ1) | 2.0% | 2.5% |
| Interquartile 75% (IQ3) | 2.8% | 3.1% |
| Interquartile Range (IQR) | 0.77% | 0.64% |
| Standard Deviation (Sample) | 0.84% | 0.71% |
| Standard Deviation (Population) | 0.83% | 0.70% |
Similar Demographics by Self-Care Disability
Demographics Similar to Immigrants from Guatemala by Self-Care Disability
In terms of self-care disability, the demographic groups most similar to Immigrants from Guatemala are Albanian (2.6%, a difference of 0.030%), Liberian (2.6%, a difference of 0.070%), Vietnamese (2.6%, a difference of 0.070%), Bahamian (2.6%, a difference of 0.11%), and Guamanian/Chamorro (2.6%, a difference of 0.15%).
| Demographics | Rating | Rank | Self-Care Disability |
| Osage | 3.6 /100 | #224 | Tragic 2.6% |
| Iraqis | 3.2 /100 | #225 | Tragic 2.6% |
| Chinese | 2.9 /100 | #226 | Tragic 2.6% |
| Immigrants | Philippines | 2.7 /100 | #227 | Tragic 2.6% |
| Guatemalans | 2.7 /100 | #228 | Tragic 2.6% |
| Guamanians/Chamorros | 2.5 /100 | #229 | Tragic 2.6% |
| Immigrants | Ecuador | 2.5 /100 | #230 | Tragic 2.6% |
| Immigrants | Guatemala | 2.2 /100 | #231 | Tragic 2.6% |
| Albanians | 2.2 /100 | #232 | Tragic 2.6% |
| Liberians | 2.1 /100 | #233 | Tragic 2.6% |
| Vietnamese | 2.1 /100 | #234 | Tragic 2.6% |
| Bahamians | 2.0 /100 | #235 | Tragic 2.6% |
| Bermudans | 1.9 /100 | #236 | Tragic 2.6% |
| Immigrants | Senegal | 1.6 /100 | #237 | Tragic 2.6% |
| Senegalese | 1.3 /100 | #238 | Tragic 2.6% |
Demographics Similar to Jamaicans by Self-Care Disability
In terms of self-care disability, the demographic groups most similar to Jamaicans are Fijian (2.7%, a difference of 0.040%), Delaware (2.7%, a difference of 0.080%), Apache (2.7%, a difference of 0.16%), Immigrants from Iraq (2.7%, a difference of 0.17%), and Hispanic or Latino (2.7%, a difference of 0.33%).
| Demographics | Rating | Rank | Self-Care Disability |
| Ottawa | 0.1 /100 | #278 | Tragic 2.7% |
| Iroquois | 0.1 /100 | #279 | Tragic 2.7% |
| Hispanics or Latinos | 0.1 /100 | #280 | Tragic 2.7% |
| Immigrants | Iraq | 0.0 /100 | #281 | Tragic 2.7% |
| Apache | 0.0 /100 | #282 | Tragic 2.7% |
| Delaware | 0.0 /100 | #283 | Tragic 2.7% |
| Fijians | 0.0 /100 | #284 | Tragic 2.7% |
| Jamaicans | 0.0 /100 | #285 | Tragic 2.7% |
| French American Indians | 0.0 /100 | #286 | Tragic 2.7% |
| Immigrants | Jamaica | 0.0 /100 | #287 | Tragic 2.7% |
| Immigrants | Barbados | 0.0 /100 | #288 | Tragic 2.7% |
| Africans | 0.0 /100 | #289 | Tragic 2.7% |
| Cubans | 0.0 /100 | #290 | Tragic 2.7% |
| Guyanese | 0.0 /100 | #291 | Tragic 2.7% |
| Central American Indians | 0.0 /100 | #292 | Tragic 2.7% |