Immigrants from Greece vs Immigrants from North Macedonia Master's Degree
COMPARE
Immigrants from Greece
Immigrants from North Macedonia
Master's Degree
Master's Degree Comparison
Immigrants from Greece
Immigrants from North Macedonia
19.0%
MASTER'S DEGREE
100.0/ 100
METRIC RATING
43rd/ 347
METRIC RANK
15.2%
MASTER'S DEGREE
64.5/ 100
METRIC RATING
168th/ 347
METRIC RANK
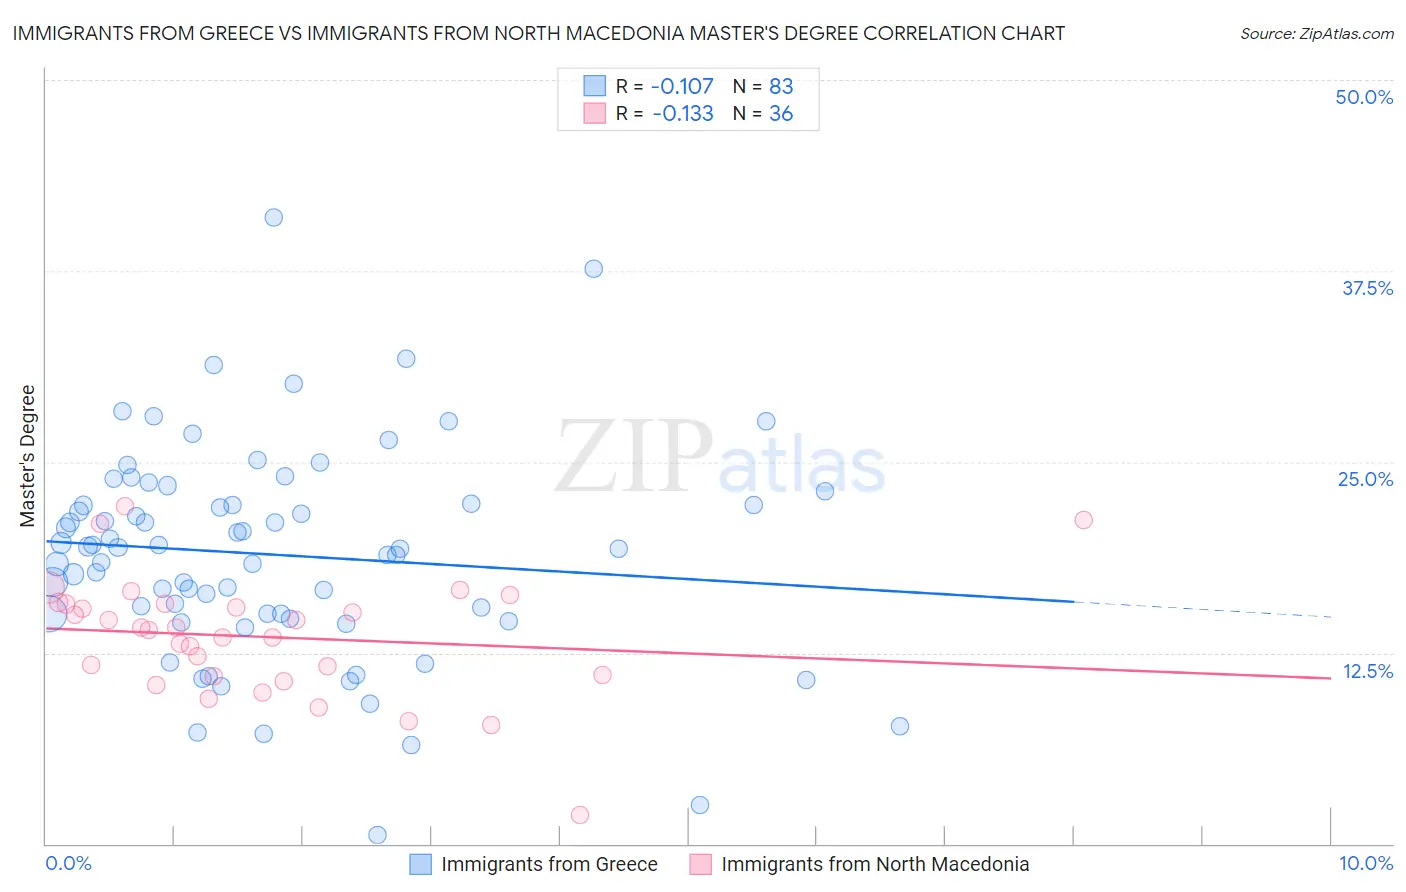
Immigrants from Greece vs Immigrants from North Macedonia Master's Degree Correlation Chart
The statistical analysis conducted on geographies consisting of 216,873,414 people shows a poor negative correlation between the proportion of Immigrants from Greece and percentage of population with at least master's degree education in the United States with a correlation coefficient (R) of -0.107 and weighted average of 19.0%. Similarly, the statistical analysis conducted on geographies consisting of 74,057,468 people shows a poor negative correlation between the proportion of Immigrants from North Macedonia and percentage of population with at least master's degree education in the United States with a correlation coefficient (R) of -0.133 and weighted average of 15.2%, a difference of 24.7%.
Master's Degree Correlation Summary
| Measurement | Immigrants from Greece | Immigrants from North Macedonia |
| Minimum | 0.57% | 1.9% |
| Maximum | 41.0% | 22.1% |
| Range | 40.4% | 20.2% |
| Mean | 18.9% | 13.6% |
| Median | 19.3% | 14.1% |
| Interquartile 25% (IQ1) | 15.1% | 11.0% |
| Interquartile 75% (IQ3) | 22.3% | 15.7% |
| Interquartile Range (IQR) | 7.2% | 4.7% |
| Standard Deviation (Sample) | 7.0% | 3.9% |
| Standard Deviation (Population) | 7.0% | 3.9% |
Similar Demographics by Master's Degree
Demographics Similar to Immigrants from Greece by Master's Degree
In terms of master's degree, the demographic groups most similar to Immigrants from Greece are Immigrants from Saudi Arabia (19.0%, a difference of 0.010%), Immigrants from Malaysia (18.9%, a difference of 0.28%), Immigrants from Belarus (18.9%, a difference of 0.39%), Immigrants from Latvia (19.1%, a difference of 0.44%), and Immigrants from Norway (18.8%, a difference of 0.78%).
| Demographics | Rating | Rank | Master's Degree |
| Immigrants | Russia | 100.0 /100 | #36 | Exceptional 19.4% |
| Mongolians | 100.0 /100 | #37 | Exceptional 19.4% |
| Bolivians | 100.0 /100 | #38 | Exceptional 19.3% |
| Immigrants | Spain | 100.0 /100 | #39 | Exceptional 19.1% |
| Immigrants | Bolivia | 100.0 /100 | #40 | Exceptional 19.1% |
| Immigrants | Latvia | 100.0 /100 | #41 | Exceptional 19.1% |
| Immigrants | Saudi Arabia | 100.0 /100 | #42 | Exceptional 19.0% |
| Immigrants | Greece | 100.0 /100 | #43 | Exceptional 19.0% |
| Immigrants | Malaysia | 100.0 /100 | #44 | Exceptional 18.9% |
| Immigrants | Belarus | 100.0 /100 | #45 | Exceptional 18.9% |
| Immigrants | Norway | 100.0 /100 | #46 | Exceptional 18.8% |
| Immigrants | Austria | 100.0 /100 | #47 | Exceptional 18.8% |
| Paraguayans | 100.0 /100 | #48 | Exceptional 18.8% |
| Estonians | 100.0 /100 | #49 | Exceptional 18.8% |
| Bulgarians | 100.0 /100 | #50 | Exceptional 18.8% |
Demographics Similar to Immigrants from North Macedonia by Master's Degree
In terms of master's degree, the demographic groups most similar to Immigrants from North Macedonia are Senegalese (15.2%, a difference of 0.14%), Swedish (15.2%, a difference of 0.22%), Scottish (15.2%, a difference of 0.25%), Immigrants from Kenya (15.3%, a difference of 0.29%), and Colombian (15.3%, a difference of 0.33%).
| Demographics | Rating | Rank | Master's Degree |
| Sudanese | 68.7 /100 | #161 | Good 15.3% |
| Peruvians | 68.7 /100 | #162 | Good 15.3% |
| Uruguayans | 67.1 /100 | #163 | Good 15.3% |
| Colombians | 66.9 /100 | #164 | Good 15.3% |
| Immigrants | Kenya | 66.6 /100 | #165 | Good 15.3% |
| Swedes | 66.1 /100 | #166 | Good 15.2% |
| Senegalese | 65.6 /100 | #167 | Good 15.2% |
| Immigrants | North Macedonia | 64.5 /100 | #168 | Good 15.2% |
| Scottish | 62.7 /100 | #169 | Good 15.2% |
| Irish | 56.3 /100 | #170 | Average 15.0% |
| Immigrants | Ghana | 53.6 /100 | #171 | Average 15.0% |
| Immigrants | Uruguay | 52.8 /100 | #172 | Average 15.0% |
| Costa Ricans | 52.5 /100 | #173 | Average 15.0% |
| Slovaks | 50.0 /100 | #174 | Average 14.9% |
| Immigrants | Peru | 49.6 /100 | #175 | Average 14.9% |