Immigrants from Greece vs Delaware Male Disability
COMPARE
Immigrants from Greece
Delaware
Male Disability
Male Disability Comparison
Immigrants from Greece
Delaware
10.7%
MALE DISABILITY
95.6/ 100
METRIC RATING
101st/ 347
METRIC RANK
13.5%
MALE DISABILITY
0.0/ 100
METRIC RATING
311th/ 347
METRIC RANK
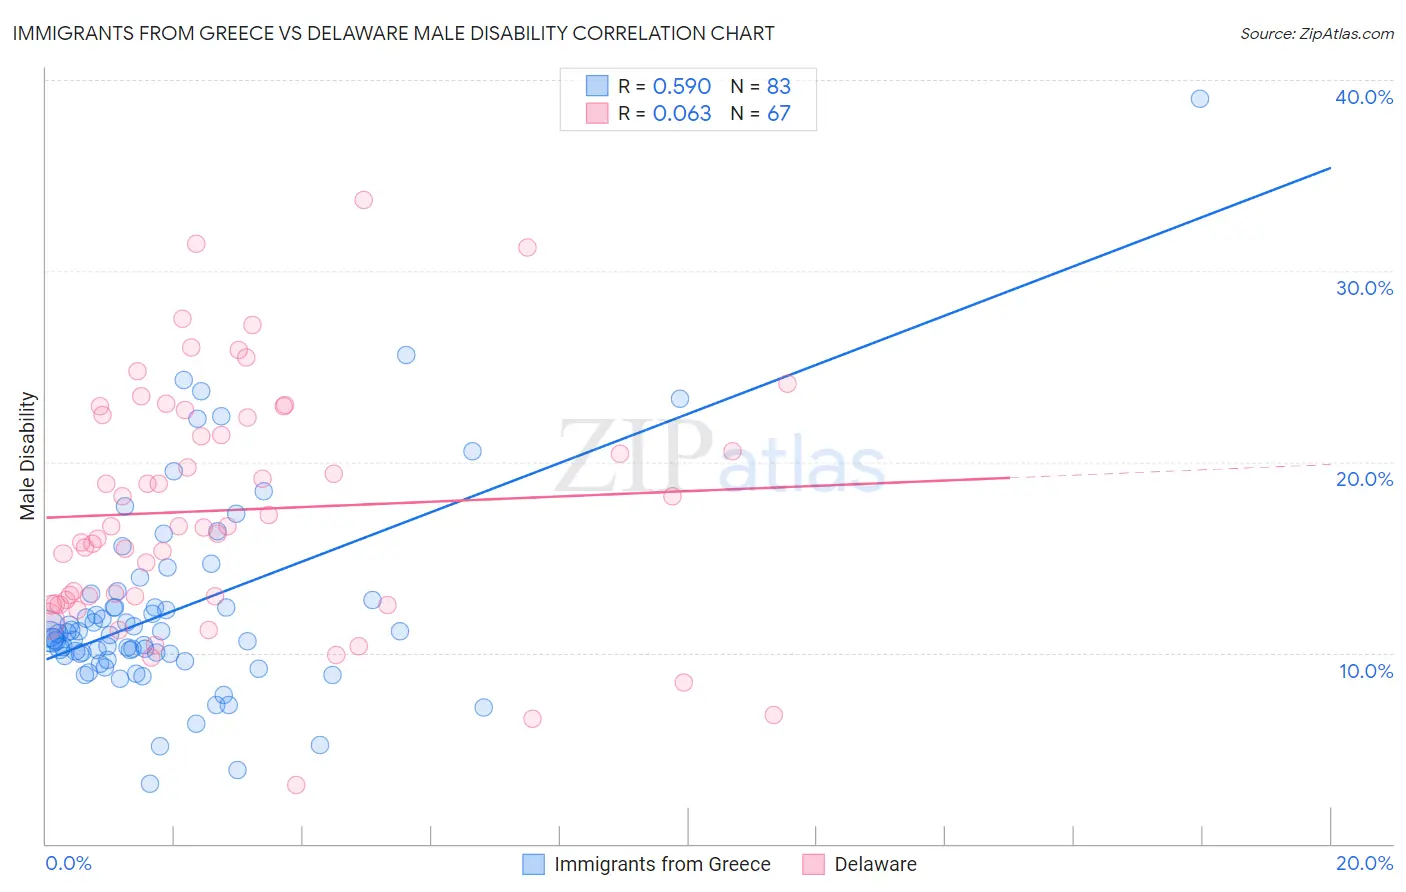
Immigrants from Greece vs Delaware Male Disability Correlation Chart
The statistical analysis conducted on geographies consisting of 216,877,187 people shows a substantial positive correlation between the proportion of Immigrants from Greece and percentage of males with a disability in the United States with a correlation coefficient (R) of 0.590 and weighted average of 10.7%. Similarly, the statistical analysis conducted on geographies consisting of 96,239,516 people shows a slight positive correlation between the proportion of Delaware and percentage of males with a disability in the United States with a correlation coefficient (R) of 0.063 and weighted average of 13.5%, a difference of 25.4%.
Male Disability Correlation Summary
| Measurement | Immigrants from Greece | Delaware |
| Minimum | 3.1% | 3.1% |
| Maximum | 39.0% | 33.7% |
| Range | 35.9% | 30.6% |
| Mean | 12.3% | 17.5% |
| Median | 11.0% | 16.6% |
| Interquartile 25% (IQ1) | 9.8% | 12.7% |
| Interquartile 75% (IQ3) | 12.8% | 22.4% |
| Interquartile Range (IQR) | 2.9% | 9.7% |
| Standard Deviation (Sample) | 5.4% | 6.3% |
| Standard Deviation (Population) | 5.3% | 6.2% |
Similar Demographics by Male Disability
Demographics Similar to Immigrants from Greece by Male Disability
In terms of male disability, the demographic groups most similar to Immigrants from Greece are Immigrants from Eastern Europe (10.7%, a difference of 0.10%), Immigrants from Kazakhstan (10.7%, a difference of 0.11%), Uruguayan (10.7%, a difference of 0.11%), Immigrants from Nigeria (10.8%, a difference of 0.17%), and Immigrants from Switzerland (10.7%, a difference of 0.18%).
| Demographics | Rating | Rank | Male Disability |
| Immigrants | Sweden | 96.9 /100 | #94 | Exceptional 10.7% |
| Chileans | 96.9 /100 | #95 | Exceptional 10.7% |
| Nicaraguans | 96.6 /100 | #96 | Exceptional 10.7% |
| Immigrants | Armenia | 96.6 /100 | #97 | Exceptional 10.7% |
| Immigrants | Romania | 96.5 /100 | #98 | Exceptional 10.7% |
| Immigrants | Switzerland | 96.1 /100 | #99 | Exceptional 10.7% |
| Immigrants | Kazakhstan | 95.9 /100 | #100 | Exceptional 10.7% |
| Immigrants | Greece | 95.6 /100 | #101 | Exceptional 10.7% |
| Immigrants | Eastern Europe | 95.3 /100 | #102 | Exceptional 10.7% |
| Uruguayans | 95.3 /100 | #103 | Exceptional 10.7% |
| Immigrants | Nigeria | 95.1 /100 | #104 | Exceptional 10.8% |
| Immigrants | Brazil | 95.0 /100 | #105 | Exceptional 10.8% |
| Immigrants | Syria | 94.9 /100 | #106 | Exceptional 10.8% |
| Immigrants | Eastern Africa | 94.3 /100 | #107 | Exceptional 10.8% |
| Immigrants | Belgium | 94.2 /100 | #108 | Exceptional 10.8% |
Demographics Similar to Delaware by Male Disability
In terms of male disability, the demographic groups most similar to Delaware are Immigrants from the Azores (13.4%, a difference of 0.19%), Blackfeet (13.4%, a difference of 0.33%), Yakama (13.5%, a difference of 0.55%), Puget Sound Salish (13.5%, a difference of 0.57%), and Aleut (13.5%, a difference of 0.63%).
| Demographics | Rating | Rank | Male Disability |
| Blacks/African Americans | 0.0 /100 | #304 | Tragic 13.2% |
| French Canadians | 0.0 /100 | #305 | Tragic 13.3% |
| Spanish Americans | 0.0 /100 | #306 | Tragic 13.3% |
| Arapaho | 0.0 /100 | #307 | Tragic 13.3% |
| French American Indians | 0.0 /100 | #308 | Tragic 13.4% |
| Blackfeet | 0.0 /100 | #309 | Tragic 13.4% |
| Immigrants | Azores | 0.0 /100 | #310 | Tragic 13.4% |
| Delaware | 0.0 /100 | #311 | Tragic 13.5% |
| Yakama | 0.0 /100 | #312 | Tragic 13.5% |
| Puget Sound Salish | 0.0 /100 | #313 | Tragic 13.5% |
| Aleuts | 0.0 /100 | #314 | Tragic 13.5% |
| Iroquois | 0.0 /100 | #315 | Tragic 13.6% |
| Alaska Natives | 0.0 /100 | #316 | Tragic 13.6% |
| Paiute | 0.0 /100 | #317 | Tragic 13.7% |
| Cree | 0.0 /100 | #318 | Tragic 13.7% |