Immigrants from Ghana vs Uruguayan Female Poverty Among 25-34 Year Olds
COMPARE
Immigrants from Ghana
Uruguayan
Female Poverty Among 25-34 Year Olds
Female Poverty Among 25-34 Year Olds Comparison
Immigrants from Ghana
Uruguayans
14.7%
FEMALE POVERTY AMONG 25-34 YEAR OLDS
1.4/ 100
METRIC RATING
237th/ 347
METRIC RANK
13.3%
FEMALE POVERTY AMONG 25-34 YEAR OLDS
66.9/ 100
METRIC RATING
159th/ 347
METRIC RANK
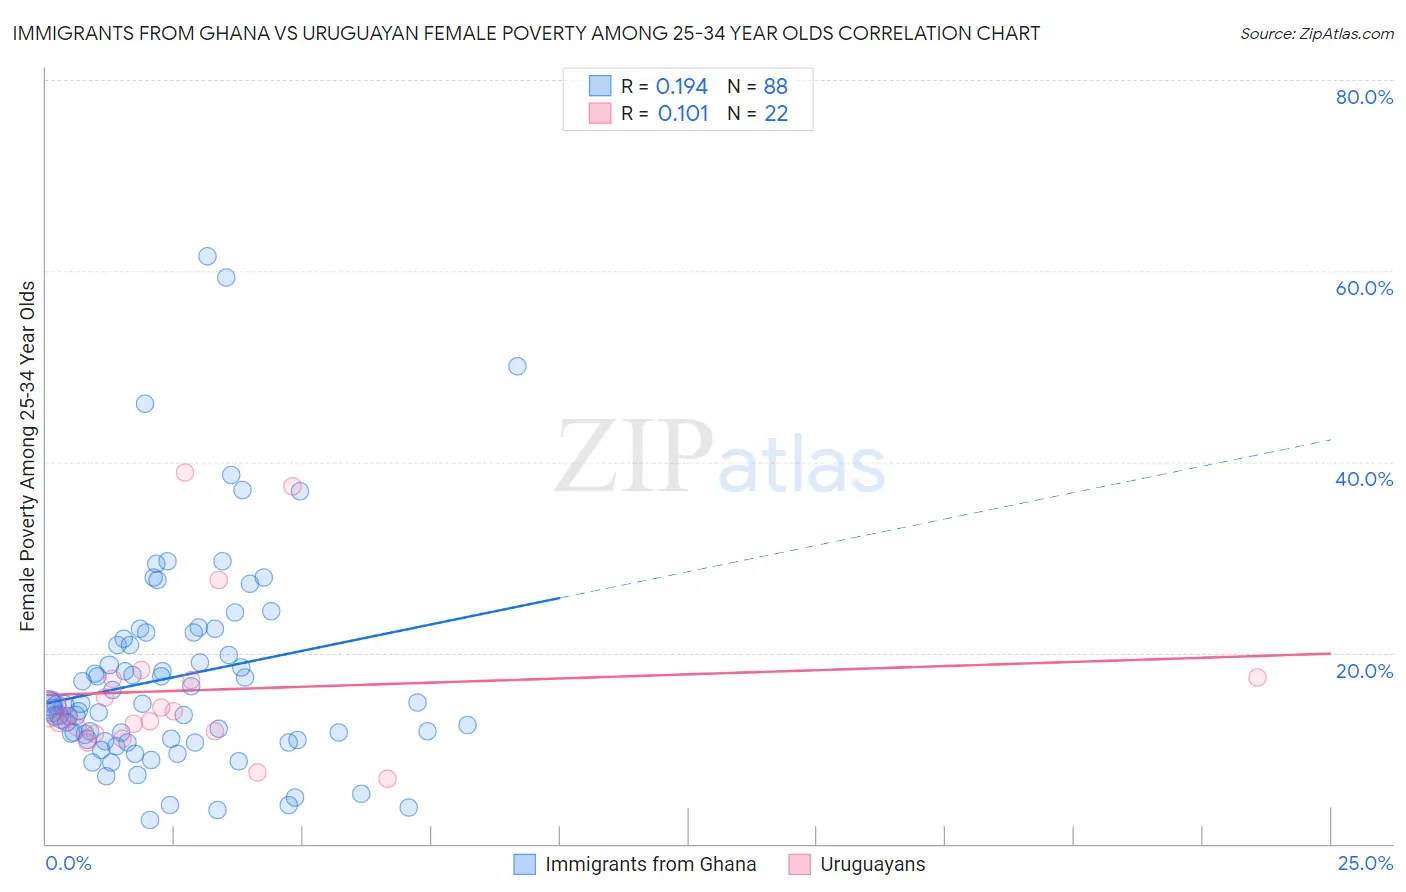
Immigrants from Ghana vs Uruguayan Female Poverty Among 25-34 Year Olds Correlation Chart
The statistical analysis conducted on geographies consisting of 198,538,106 people shows a poor positive correlation between the proportion of Immigrants from Ghana and poverty level among females between the ages 25 and 34 in the United States with a correlation coefficient (R) of 0.194 and weighted average of 14.7%. Similarly, the statistical analysis conducted on geographies consisting of 143,910,872 people shows a poor positive correlation between the proportion of Uruguayans and poverty level among females between the ages 25 and 34 in the United States with a correlation coefficient (R) of 0.101 and weighted average of 13.3%, a difference of 10.4%.
Female Poverty Among 25-34 Year Olds Correlation Summary
| Measurement | Immigrants from Ghana | Uruguayan |
| Minimum | 2.5% | 6.8% |
| Maximum | 61.5% | 38.9% |
| Range | 59.1% | 32.1% |
| Mean | 17.4% | 16.1% |
| Median | 14.5% | 13.7% |
| Interquartile 25% (IQ1) | 10.9% | 11.8% |
| Interquartile 75% (IQ3) | 21.2% | 17.2% |
| Interquartile Range (IQR) | 10.3% | 5.4% |
| Standard Deviation (Sample) | 11.1% | 8.3% |
| Standard Deviation (Population) | 11.1% | 8.1% |
Similar Demographics by Female Poverty Among 25-34 Year Olds
Demographics Similar to Immigrants from Ghana by Female Poverty Among 25-34 Year Olds
In terms of female poverty among 25-34 year olds, the demographic groups most similar to Immigrants from Ghana are Salvadoran (14.7%, a difference of 0.0%), Immigrants from Jamaica (14.7%, a difference of 0.020%), Alsatian (14.7%, a difference of 0.040%), Malaysian (14.7%, a difference of 0.070%), and Immigrants from Grenada (14.7%, a difference of 0.12%).
| Demographics | Rating | Rank | Female Poverty Among 25-34 Year Olds |
| Spaniards | 2.3 /100 | #230 | Tragic 14.6% |
| Delaware | 2.3 /100 | #231 | Tragic 14.6% |
| Immigrants | Ecuador | 1.9 /100 | #232 | Tragic 14.6% |
| Whites/Caucasians | 1.8 /100 | #233 | Tragic 14.7% |
| Cubans | 1.6 /100 | #234 | Tragic 14.7% |
| Immigrants | Jamaica | 1.4 /100 | #235 | Tragic 14.7% |
| Salvadorans | 1.4 /100 | #236 | Tragic 14.7% |
| Immigrants | Ghana | 1.4 /100 | #237 | Tragic 14.7% |
| Alsatians | 1.4 /100 | #238 | Tragic 14.7% |
| Malaysians | 1.4 /100 | #239 | Tragic 14.7% |
| Immigrants | Grenada | 1.3 /100 | #240 | Tragic 14.7% |
| Scotch-Irish | 1.2 /100 | #241 | Tragic 14.8% |
| Barbadians | 1.2 /100 | #242 | Tragic 14.8% |
| Immigrants | Nicaragua | 1.1 /100 | #243 | Tragic 14.8% |
| Immigrants | Bangladesh | 1.1 /100 | #244 | Tragic 14.8% |
Demographics Similar to Uruguayans by Female Poverty Among 25-34 Year Olds
In terms of female poverty among 25-34 year olds, the demographic groups most similar to Uruguayans are Immigrants from South America (13.3%, a difference of 0.050%), Icelander (13.3%, a difference of 0.12%), Immigrants from Colombia (13.3%, a difference of 0.22%), Ugandan (13.4%, a difference of 0.26%), and British (13.4%, a difference of 0.32%).
| Demographics | Rating | Rank | Female Poverty Among 25-34 Year Olds |
| Slavs | 75.7 /100 | #152 | Good 13.2% |
| Northern Europeans | 73.7 /100 | #153 | Good 13.2% |
| Arabs | 73.5 /100 | #154 | Good 13.2% |
| Immigrants | Sierra Leone | 72.9 /100 | #155 | Good 13.3% |
| Immigrants | Cameroon | 72.0 /100 | #156 | Good 13.3% |
| Immigrants | Western Europe | 70.3 /100 | #157 | Good 13.3% |
| Immigrants | Colombia | 69.2 /100 | #158 | Good 13.3% |
| Uruguayans | 66.9 /100 | #159 | Good 13.3% |
| Immigrants | South America | 66.3 /100 | #160 | Good 13.3% |
| Icelanders | 65.7 /100 | #161 | Good 13.3% |
| Ugandans | 64.1 /100 | #162 | Good 13.4% |
| British | 63.5 /100 | #163 | Good 13.4% |
| Swiss | 61.7 /100 | #164 | Good 13.4% |
| Basques | 59.3 /100 | #165 | Average 13.4% |
| Belgians | 58.9 /100 | #166 | Average 13.4% |