Immigrants from Liberia vs Immigrants from Brazil Disability
COMPARE
Immigrants from Liberia
Immigrants from Brazil
Disability
Disability Comparison
Immigrants from Liberia
Immigrants from Brazil
12.4%
DISABILITY
0.4/ 100
METRIC RATING
260th/ 347
METRIC RANK
11.2%
DISABILITY
98.1/ 100
METRIC RATING
90th/ 347
METRIC RANK
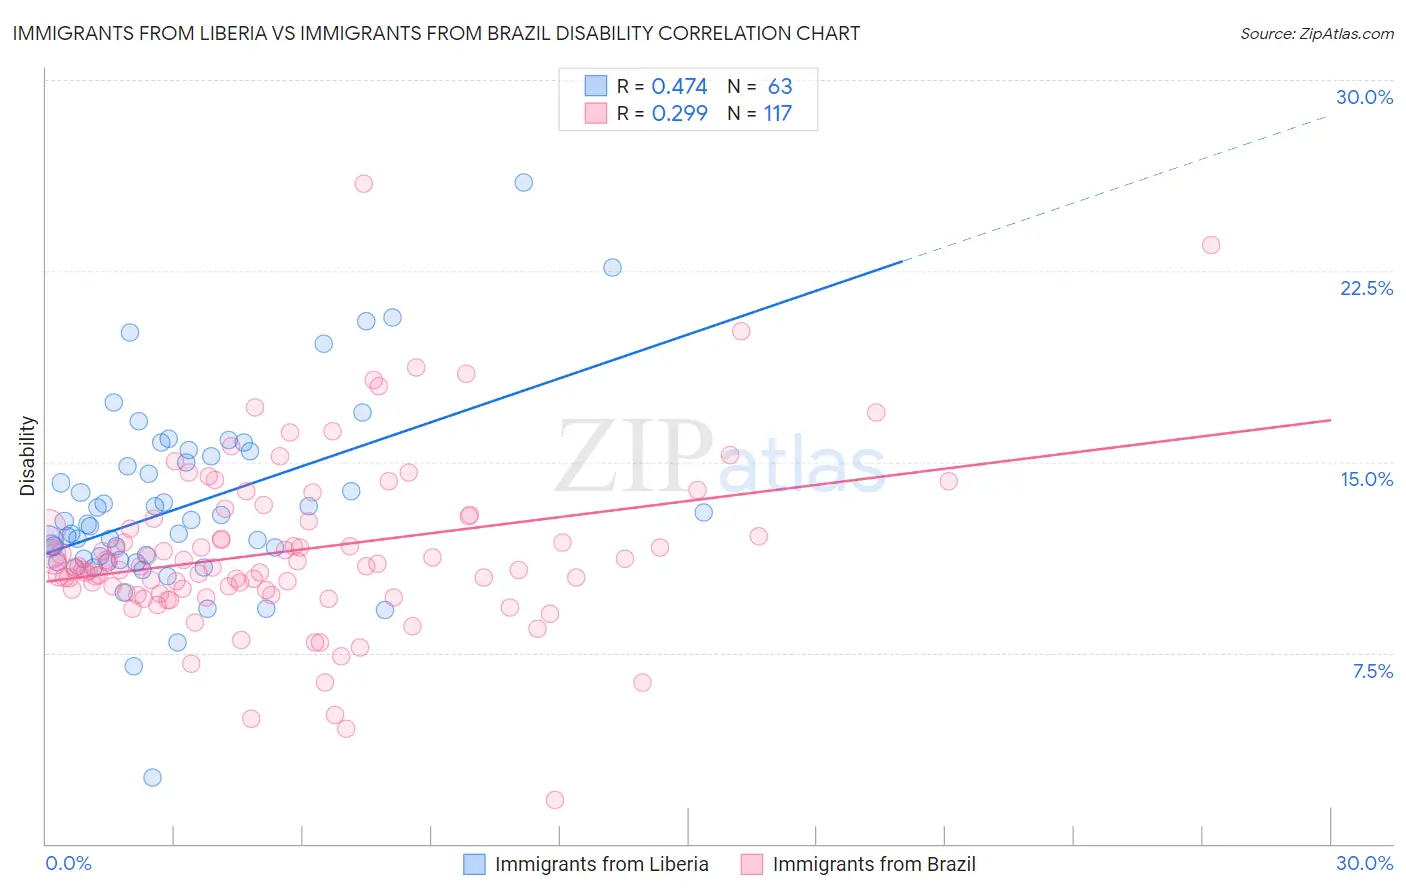
Immigrants from Liberia vs Immigrants from Brazil Disability Correlation Chart
The statistical analysis conducted on geographies consisting of 135,259,590 people shows a moderate positive correlation between the proportion of Immigrants from Liberia and percentage of population with a disability in the United States with a correlation coefficient (R) of 0.474 and weighted average of 12.4%. Similarly, the statistical analysis conducted on geographies consisting of 343,011,527 people shows a weak positive correlation between the proportion of Immigrants from Brazil and percentage of population with a disability in the United States with a correlation coefficient (R) of 0.299 and weighted average of 11.2%, a difference of 10.9%.
Disability Correlation Summary
| Measurement | Immigrants from Liberia | Immigrants from Brazil |
| Minimum | 2.6% | 1.7% |
| Maximum | 26.0% | 25.9% |
| Range | 23.4% | 24.2% |
| Mean | 13.3% | 11.5% |
| Median | 12.5% | 10.9% |
| Interquartile 25% (IQ1) | 11.2% | 9.9% |
| Interquartile 75% (IQ3) | 15.2% | 12.7% |
| Interquartile Range (IQR) | 4.1% | 2.8% |
| Standard Deviation (Sample) | 3.7% | 3.4% |
| Standard Deviation (Population) | 3.7% | 3.4% |
Similar Demographics by Disability
Demographics Similar to Immigrants from Liberia by Disability
In terms of disability, the demographic groups most similar to Immigrants from Liberia are Canadian (12.4%, a difference of 0.030%), Scandinavian (12.4%, a difference of 0.070%), Slavic (12.4%, a difference of 0.090%), Immigrants from Laos (12.4%, a difference of 0.23%), and Immigrants from Dominica (12.4%, a difference of 0.32%).
| Demographics | Rating | Rank | Disability |
| Belgians | 0.8 /100 | #253 | Tragic 12.3% |
| German Russians | 0.8 /100 | #254 | Tragic 12.3% |
| Slovenes | 0.6 /100 | #255 | Tragic 12.4% |
| Immigrants | Dominica | 0.6 /100 | #256 | Tragic 12.4% |
| Immigrants | Laos | 0.5 /100 | #257 | Tragic 12.4% |
| Slavs | 0.5 /100 | #258 | Tragic 12.4% |
| Canadians | 0.4 /100 | #259 | Tragic 12.4% |
| Immigrants | Liberia | 0.4 /100 | #260 | Tragic 12.4% |
| Scandinavians | 0.4 /100 | #261 | Tragic 12.4% |
| Native Hawaiians | 0.3 /100 | #262 | Tragic 12.5% |
| Hawaiians | 0.2 /100 | #263 | Tragic 12.5% |
| Immigrants | Germany | 0.2 /100 | #264 | Tragic 12.5% |
| U.S. Virgin Islanders | 0.2 /100 | #265 | Tragic 12.5% |
| Czechoslovakians | 0.2 /100 | #266 | Tragic 12.5% |
| Spaniards | 0.2 /100 | #267 | Tragic 12.5% |
Demographics Similar to Immigrants from Brazil by Disability
In terms of disability, the demographic groups most similar to Immigrants from Brazil are Immigrants from Western Asia (11.2%, a difference of 0.020%), Immigrants from South Africa (11.2%, a difference of 0.050%), Ecuadorian (11.2%, a difference of 0.060%), Immigrants from Ecuador (11.2%, a difference of 0.060%), and Immigrants from Morocco (11.2%, a difference of 0.18%).
| Demographics | Rating | Rank | Disability |
| Immigrants | Switzerland | 99.0 /100 | #83 | Exceptional 11.1% |
| Immigrants | Sierra Leone | 99.0 /100 | #84 | Exceptional 11.1% |
| Immigrants | Belarus | 98.9 /100 | #85 | Exceptional 11.1% |
| Immigrants | Russia | 98.9 /100 | #86 | Exceptional 11.1% |
| Palestinians | 98.9 /100 | #87 | Exceptional 11.1% |
| Immigrants | Romania | 98.5 /100 | #88 | Exceptional 11.2% |
| Immigrants | South Africa | 98.2 /100 | #89 | Exceptional 11.2% |
| Immigrants | Brazil | 98.1 /100 | #90 | Exceptional 11.2% |
| Immigrants | Western Asia | 98.1 /100 | #91 | Exceptional 11.2% |
| Ecuadorians | 98.0 /100 | #92 | Exceptional 11.2% |
| Immigrants | Ecuador | 98.0 /100 | #93 | Exceptional 11.2% |
| Immigrants | Morocco | 97.8 /100 | #94 | Exceptional 11.2% |
| Eastern Europeans | 97.8 /100 | #95 | Exceptional 11.2% |
| Immigrants | Zimbabwe | 97.7 /100 | #96 | Exceptional 11.2% |
| Bhutanese | 97.4 /100 | #97 | Exceptional 11.2% |